Explore Attributes Data in QGIS through hands-on querying, analysis, and spatial selection using real municipal parcel data from Windsor, Canada. This tutorial walks through practical workflows for selecting features based on attribute values, calculated geometry, and spatial relationships using tools like Select by Expression, the Field Calculator, and Select by Location. You’ll calculate new attributes, generate statistics, compare zoning categories, and export results for further analysis. By combining attribute-based queries with spatial logic, the tutorial demonstrates how QGIS can be used to extract meaningful insights from complex datasets rather than simply viewing table data.
What You’ll Learn in this Tutorial
- The tutorial will help familiarize you with the QGIS query syntax, which is very similar to SQL.
- The goal of this tutorial is to select parcels using various queries, including unique values or a combination of different of values.
- You will work with municipal parcel data from Windsor, Canada, to find parcels that meet conditions based on their attributes and location.
- You will use the Select by Expression tool to make the selections.
- You will calculate new attribute data using the Field Calculator tool.
- You will calculate statistics based on attribute data using the Statistics Panel.
- You will find features on the map based on their locations relative to other features.
- You will save and export the data based on the selections.
Prerequisites
1. Create a New QGIS Project
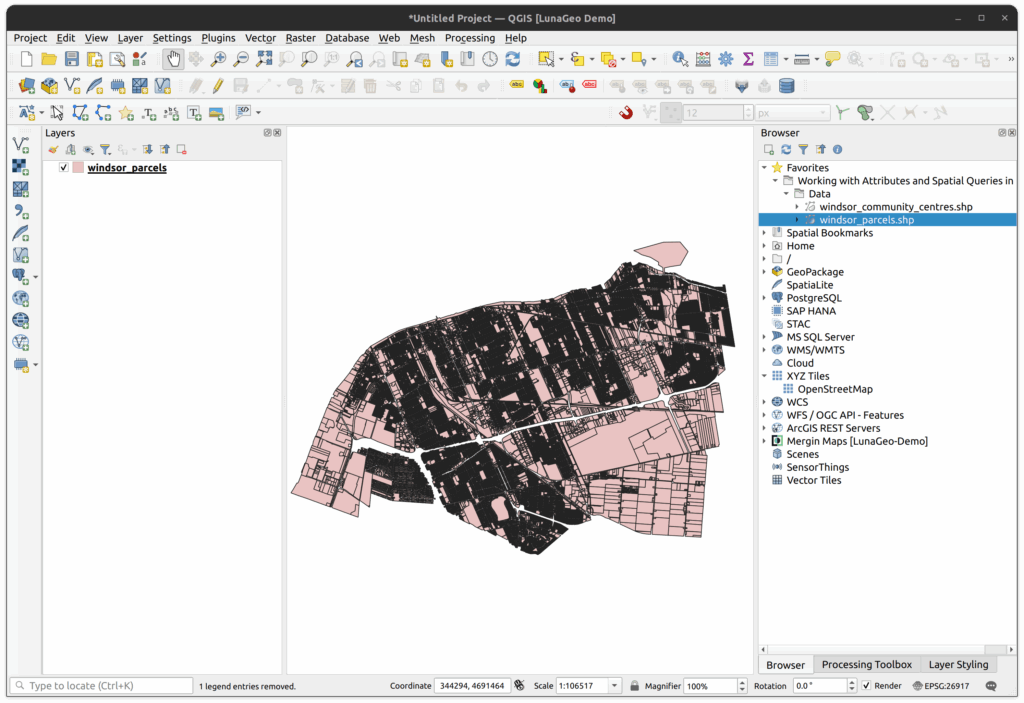
- Open QGIS 3.x and make sure the browser panel is open and docked on the right side of the screen.
- Expand the tutorial folder and add the shapefile windsor_parcels.shp to the project.
- Save the QGIS project.
- Examine the layer with the Identify tool and Attribute Table.
- Open the layer properties and examine the layer:
- What is the geometry type?
- How many features are in the layer?
- What is the CRS?
2. Select features using the Select by Expression tool in the Attributes Table
1. Open the attribute table for the Windsor parcel layer and select the Select features using an expression button
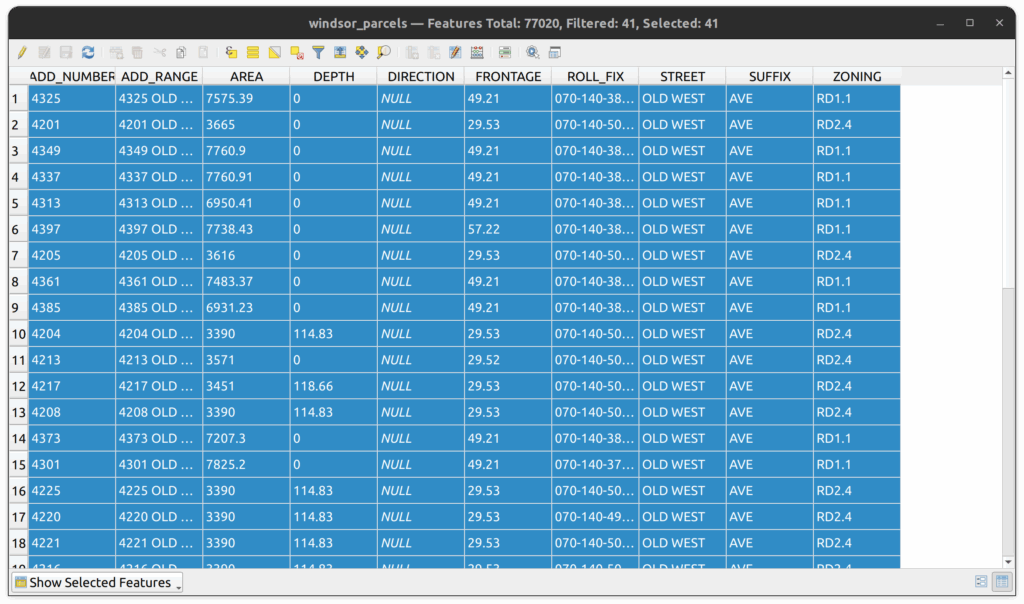
2. Select parcels by unique value. Enter “STREET” LIKE ‘OLD WEST’ and click Select Features. Then click close.
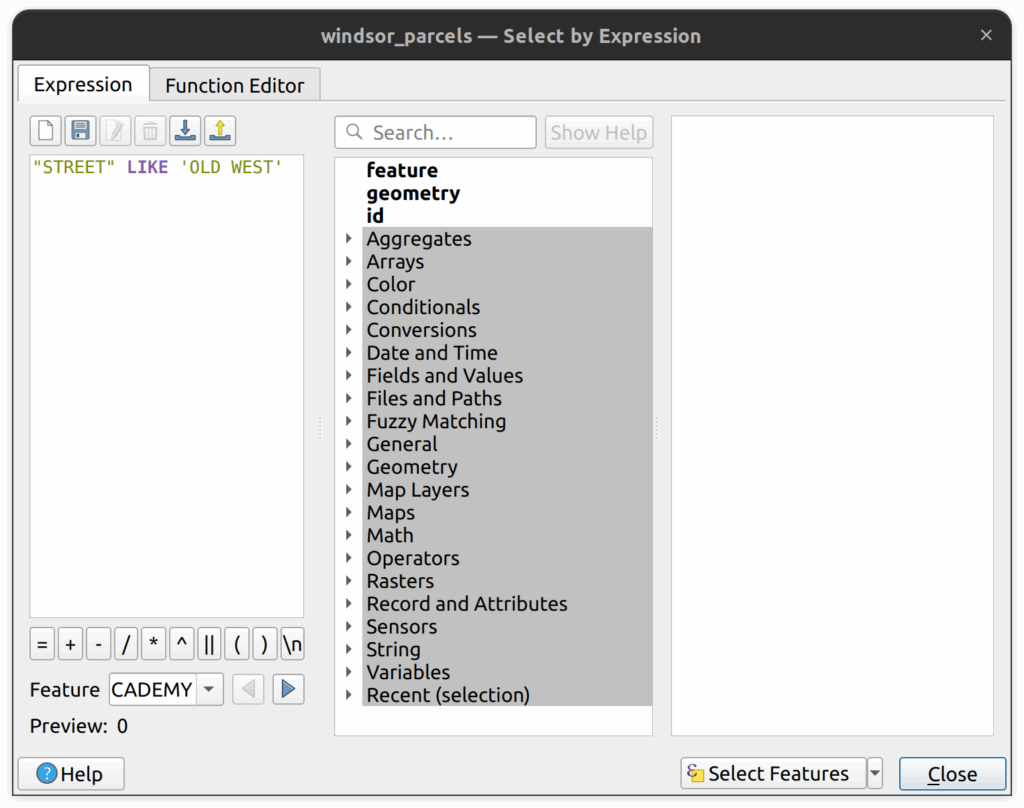
3. On the bottom left of the attribute table, change it from Show All Features to “Show Selected Features”. Now you only see the features selected with your query.
4. LIKE is case sensitive so if you did the same query with lowercase there would be no results. Try it.
5. Now try using the ILIKE operator, which is not case sensitive. Search for “STREET” ILIKE ‘old west’
6. Try using the wildcard symbol %. Search for “STREET” ILIKE ‘north%’ to find all streets with names beginning with north and note that you get results including NORTHWOOD, NORTH SERVICE, NORTHWAY and others.
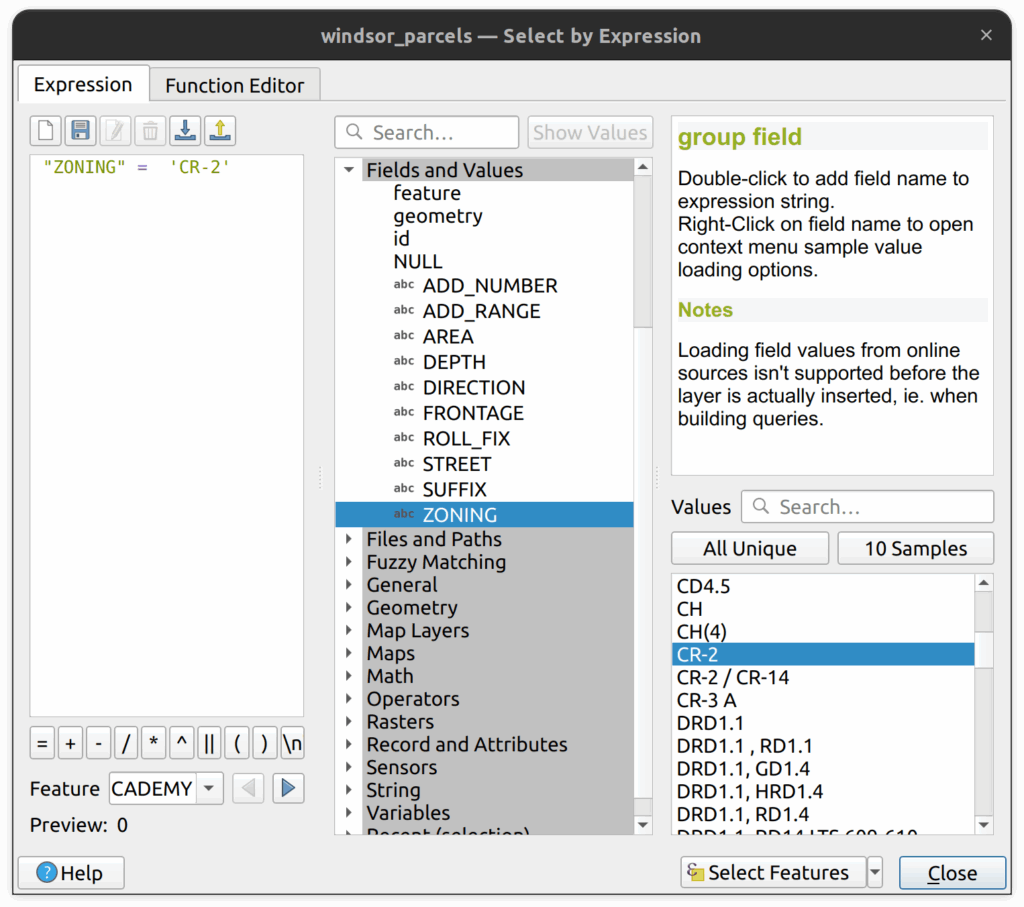
7. In the middle of the Select by Expression tool, expand the Fields and Values header and select the ZONING field. Then in the area to the right, click the All Unique button to show all unique values in that field. These are the zoning codes for the City of Windsor. CR (inversely) stands for Rural Commercial. Search for “ZONING” = ‘CR-2’ by double clicking on the ZONING field, then enter the = sign, then double click on CR-2 under the unique values. There should be 2 results. Leaving the selection, close the Select by Expression window and minimize the Attribute table.
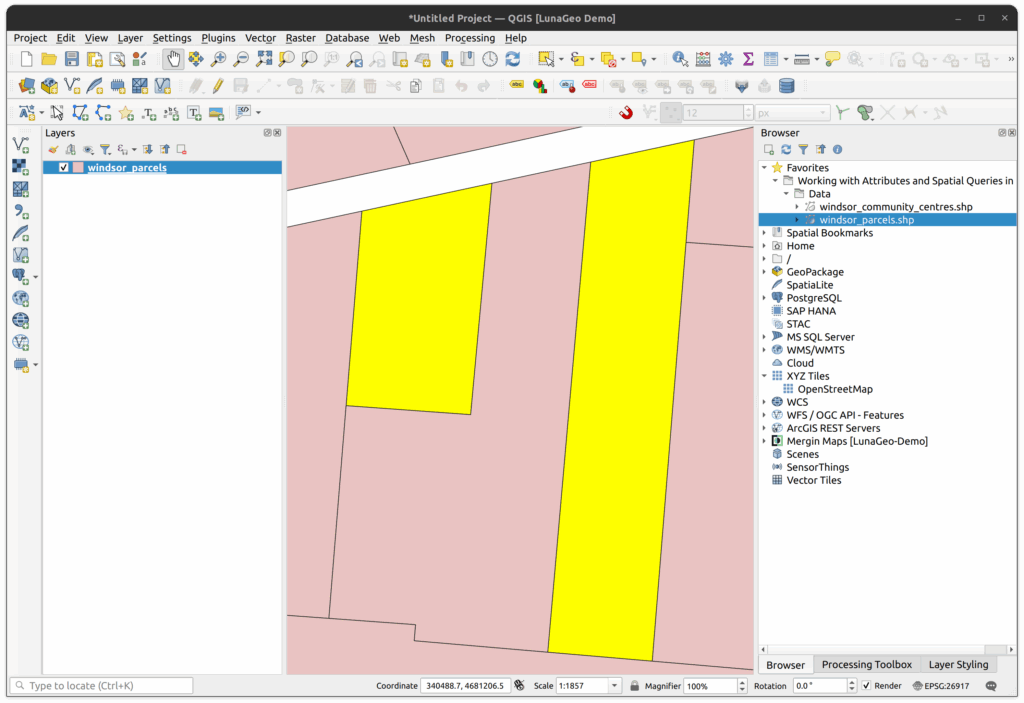
8. Right-click on the layer and select Zoom to Selection. Use the Identify tool to inspect the two parcels. What zoning codes are the surrounding parcels?
3. Select Parcels by Area
You can also use spatial functions when selecting features. For example, you might want to find polygons that are larger or smaller than a specific area. Fortunately, this can easily be done in QGIS by using the Select by Expression tool in the attributes table.
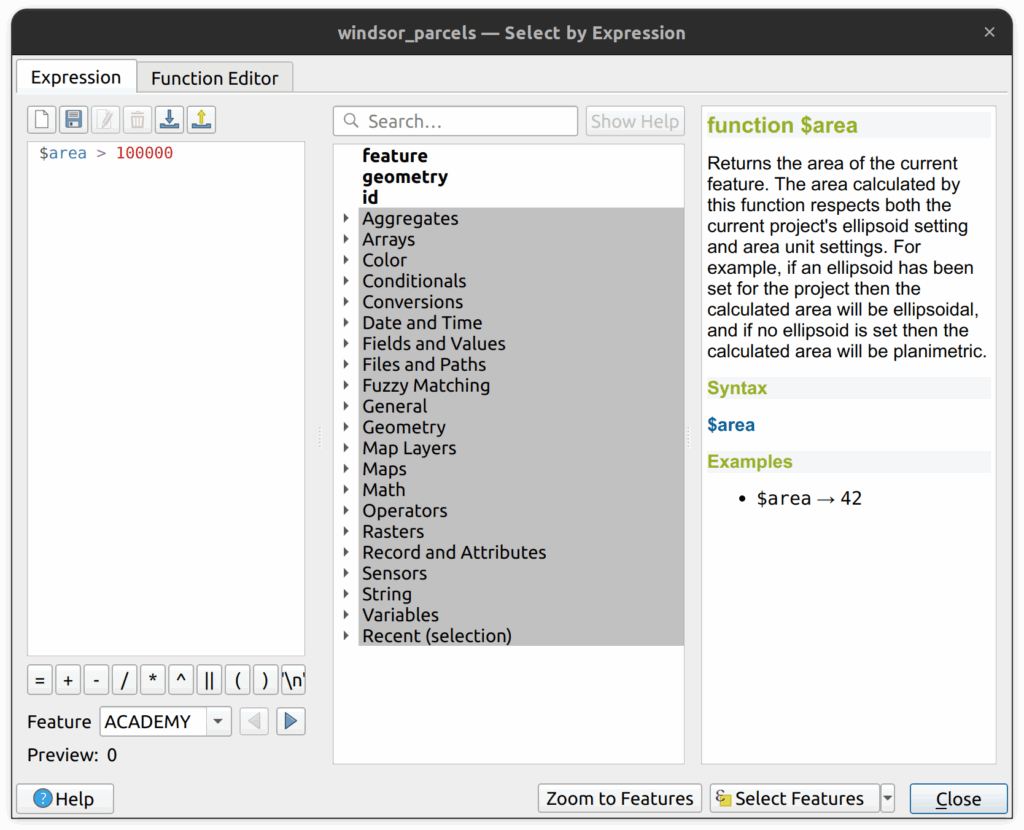
1. Under the geometry group, you can see all the functions available. Let’s use the $area function and find parcels larger than 100,000 square metres.
2. Under the geometry group of functions, double click on $area. This will add the function to the expression area. Add the greater than symbol > and 100000.
3. Click select and there should be 147 parcels selected.
4. Select Using Multiple Parameters
We can use multiple parameters in a single expression by using several different operators. In this case we will be using AND operator to find parcels larger than 100k sqm and zoned for agriculture.
1. Open the Attribute Table for the parcels and then open the Select by Expression tool.
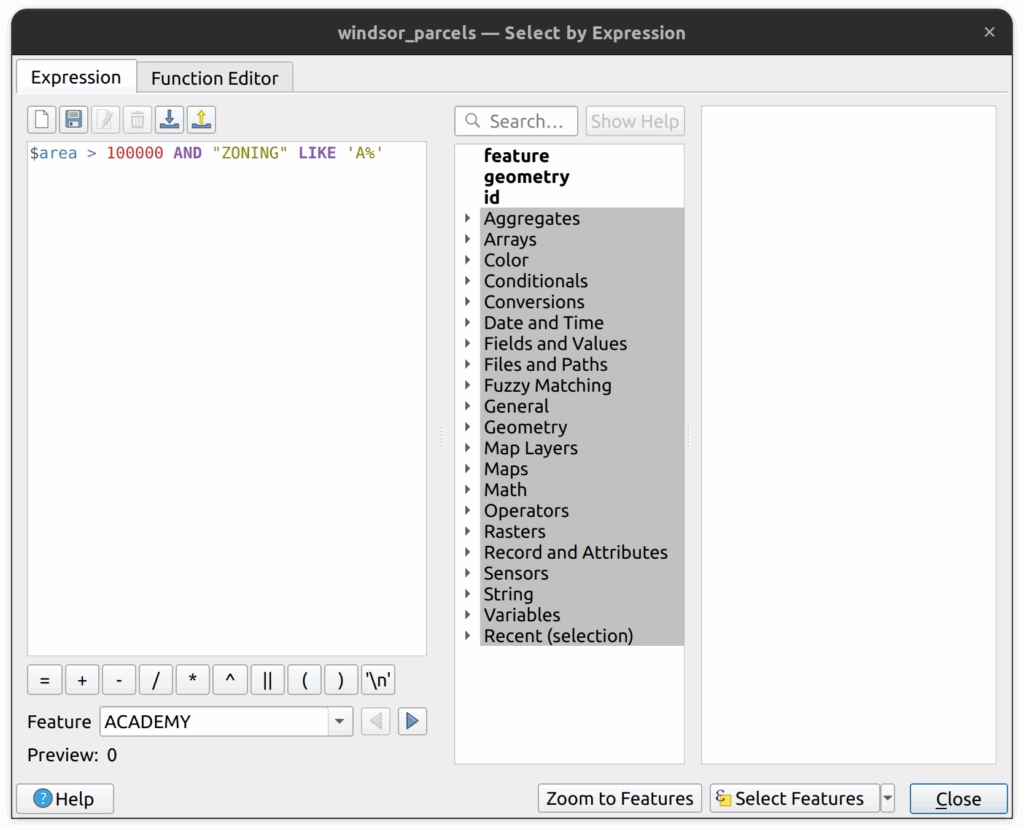
2. Select parcels that are larger than 100,000 sqm AND that have a zone that starts with the letter A. The search query should be $area > 100000 AND “ZONING” LIKE ‘A%’ and there should be 58 results.
3. View the results on the map.
5. Using OR logical operator
We can also use the OR logical operator to combine two or more tests. For example, lets find all the parcels that are larger than 100,000 sqm OR parcels that are zoned as rural commercial (CR). Try this one yourself. There should be 150 selected parcels.
1. Open the Attribute Table for the parcels and then open the Select by Expression tool.
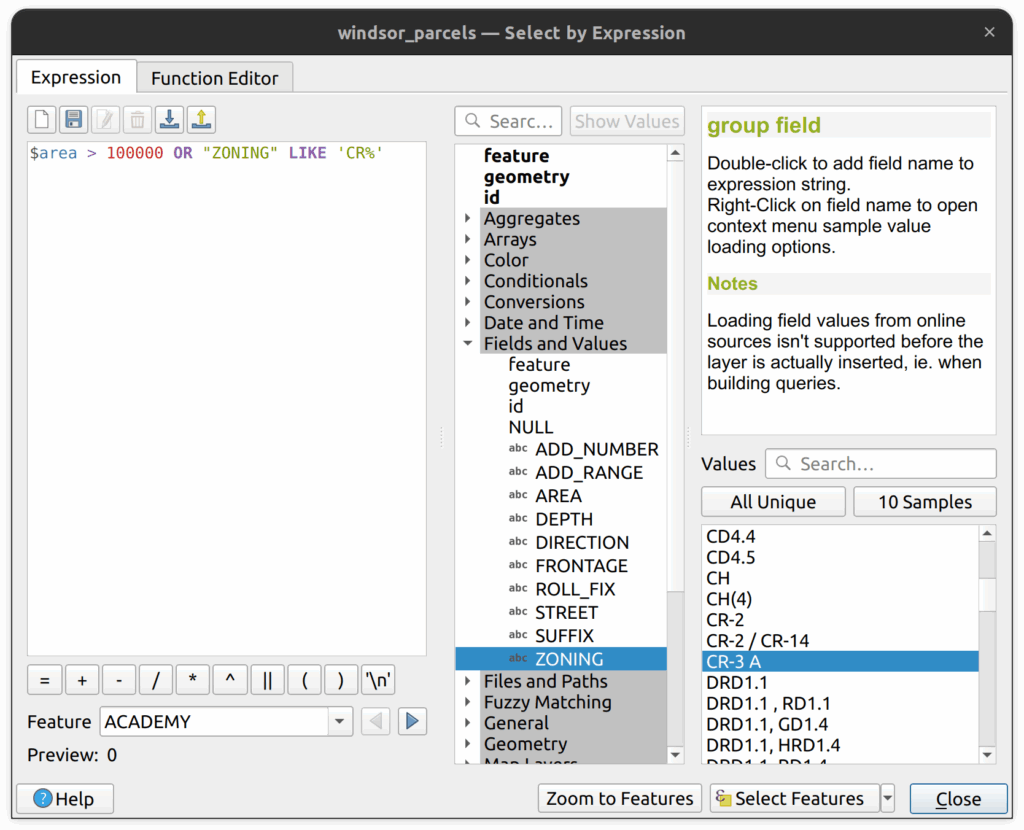
2. Select parcels that are larger than 100,000 sqm OR that have a zone that starts with the letter CR. The search query should be $area > 100000 OR “ZONING” LIKE ‘CR%’
3. There should be 150 selected parcels.
6. Field Calculator
Similar to the Select by Expression tool, we can use an expression to populate new field. In this example, you will create a new area field called hectare and calculate the area in hectares, which equals 10,000 square metres.
1. If you have a previous selection, clear that selection now.
2. Open the Attributes Table.
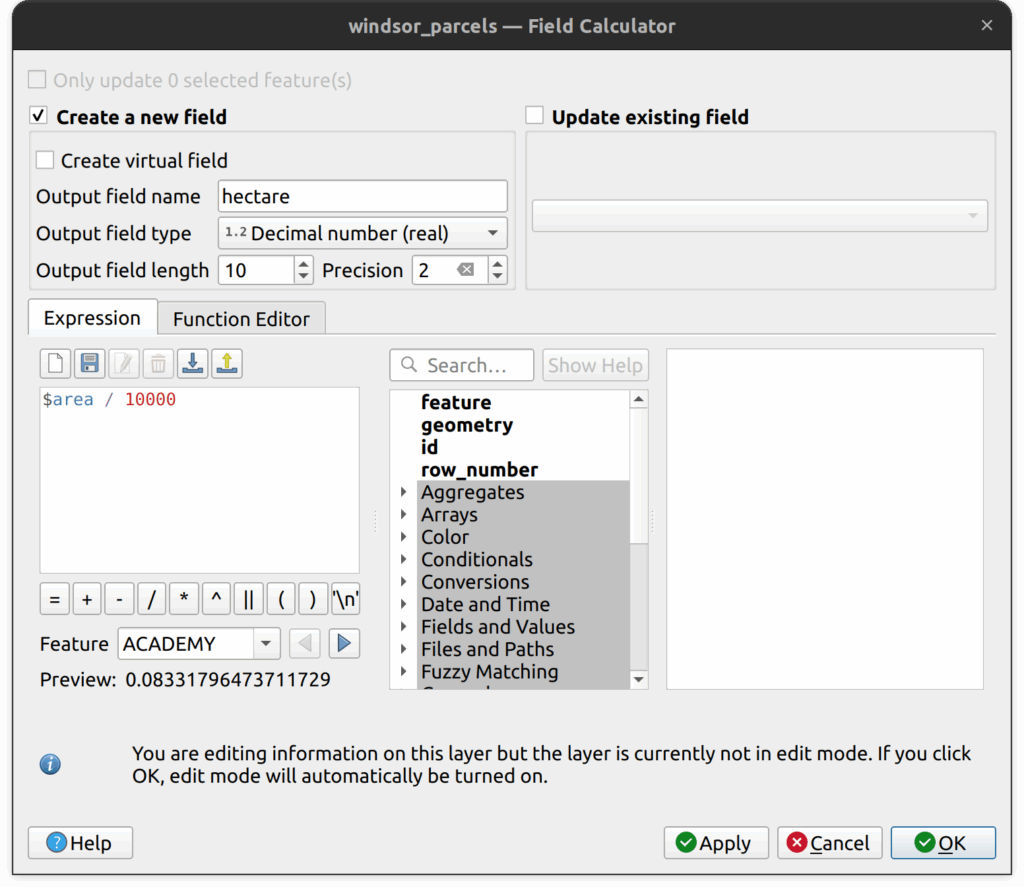
3. Open the field calculator tool and enter the following parameters:
- For Output field name, enter hectare
- For Output field type, select decimal number
- Set Output field length to 10 and precision to 2.
- In the expression field, enter $area / 10000
- Click OK.
4. Click save and toggle off the editing session to save the new field to the shapefile. Examine the layer attributes and note that a new field is created showing the area in hectares.
5. Create another field and call it sqm and calculate the area in square meters.
7. Statistics Panel
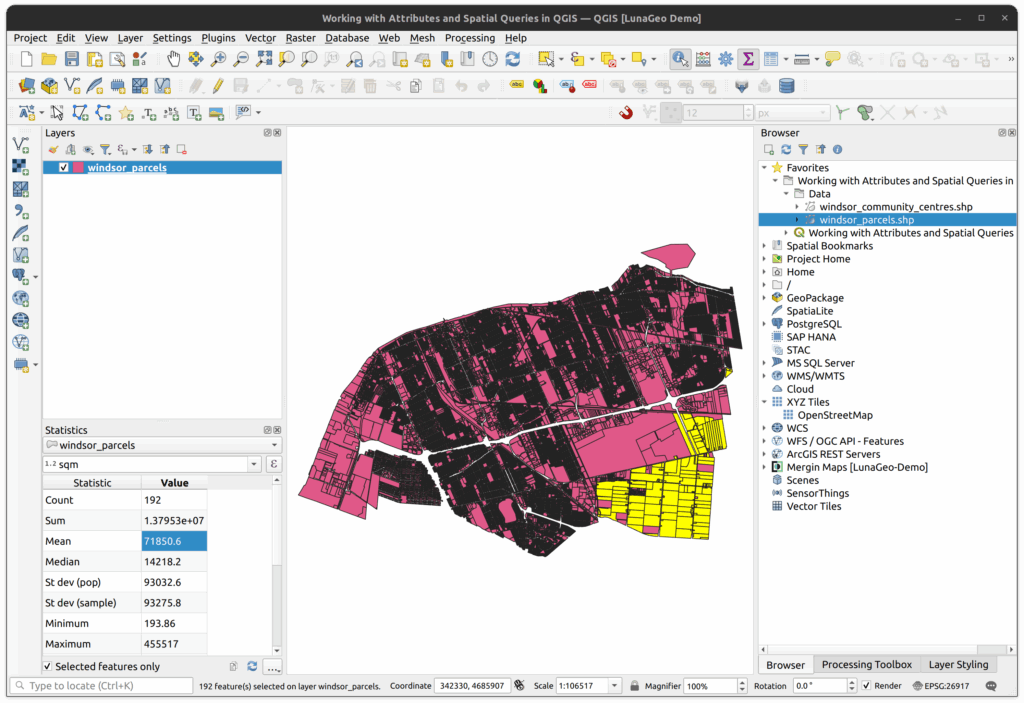
1. Open the Statistics Panel by clicking View on the top menu > Panels > Statistics Panel.
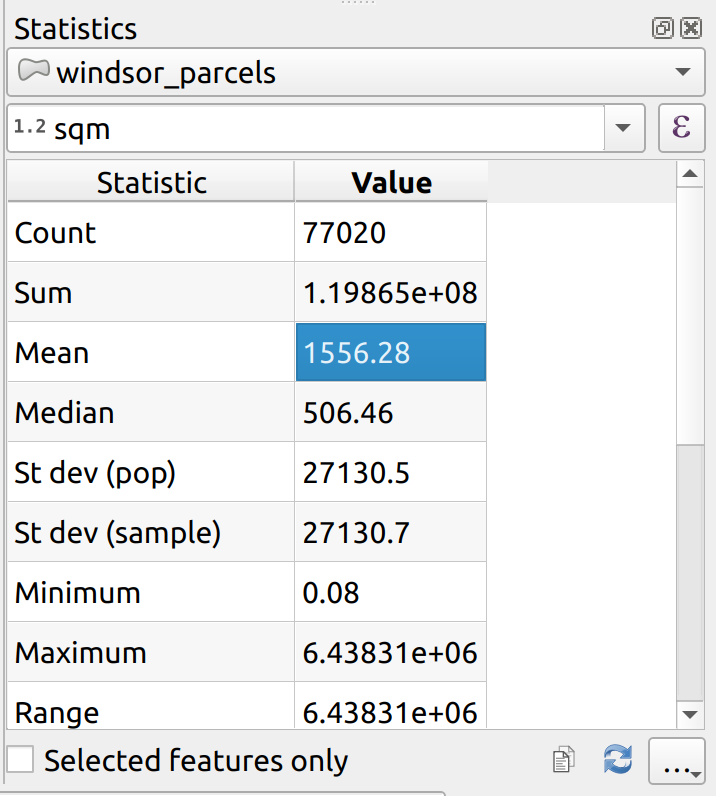
2. With windor_parcel layer selected, select the new sqm field to calculate its statistics
3. You should see the mean area is 1556.28 square metres.
4. Note that there is an option in the panel for “Selected features only”. Check that box.
5. Use the Select by Expression tool to determine the average area of all parcels zoned for agriculture (all types of agriculture zones).
Did you get a mean of 71,850.6 sqm (7.19 hectares)?
8. Statistics by Categories Tool
The Statistics by Categories tool is useful when we want to aggregate data into specific groups and compute basic statistics for each one. In this example, we will calculate the statistics for every zoning type.
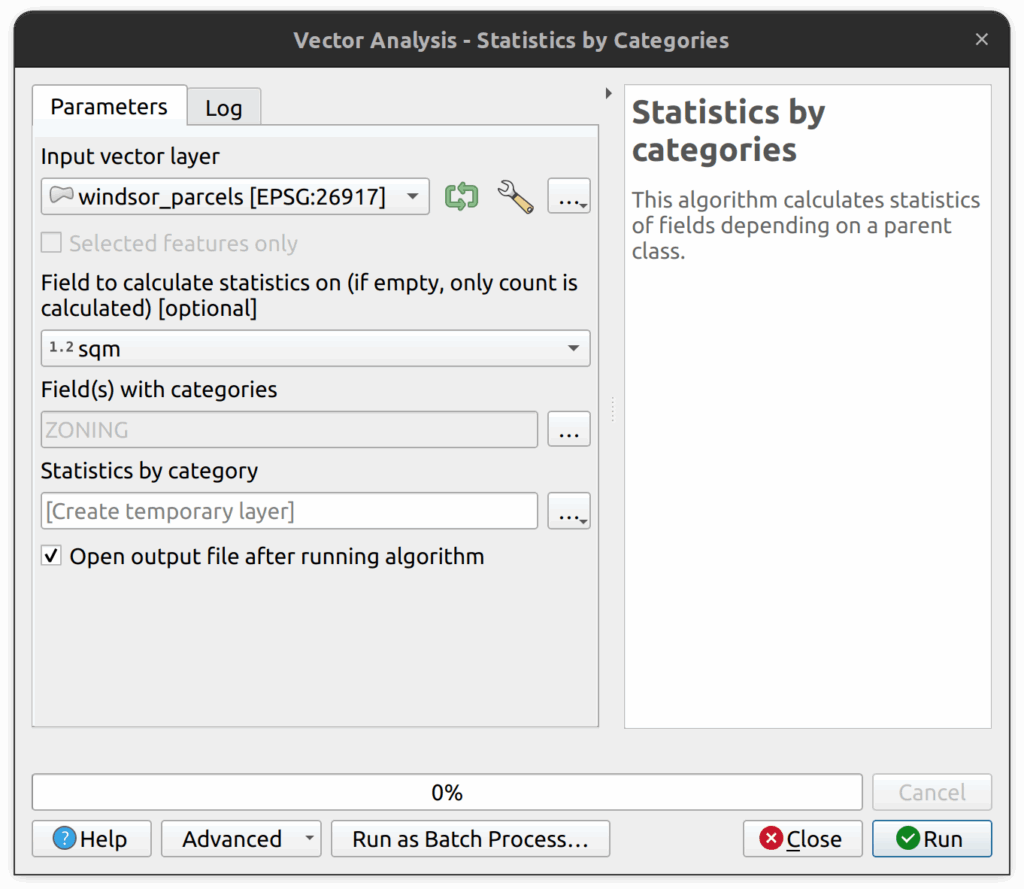
1. In the Processing panel, locate and open the Statistics by Categories tool.
2. In the Statistics by Categories tool, enter the following parameters:
- Input vector layer: windsor_parcels layer.
- Field to calculate statistics on: sqm.
- Field(s) with categories: ZONING
- Save the output as a CSV to the tutorial folder and call it zoning_statistics
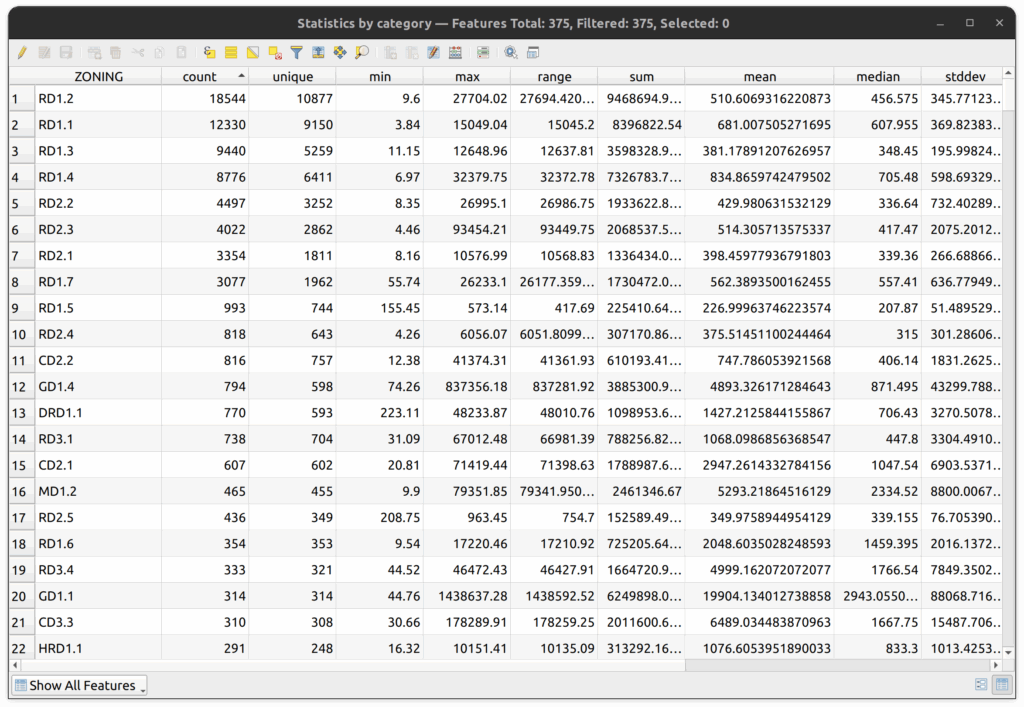
3. Click Run to execute the tool. The CSV will load in the Layers Panel when complete.
4. Open the Attributes Table of the resulting table to view the results.
9. Vector Layer Histogram Tool
1. With the windsor_parcels layer active, use the Select by Expression tool to select all the parcels zoned for agriculture (“ZONING” LIKE ‘A%’).
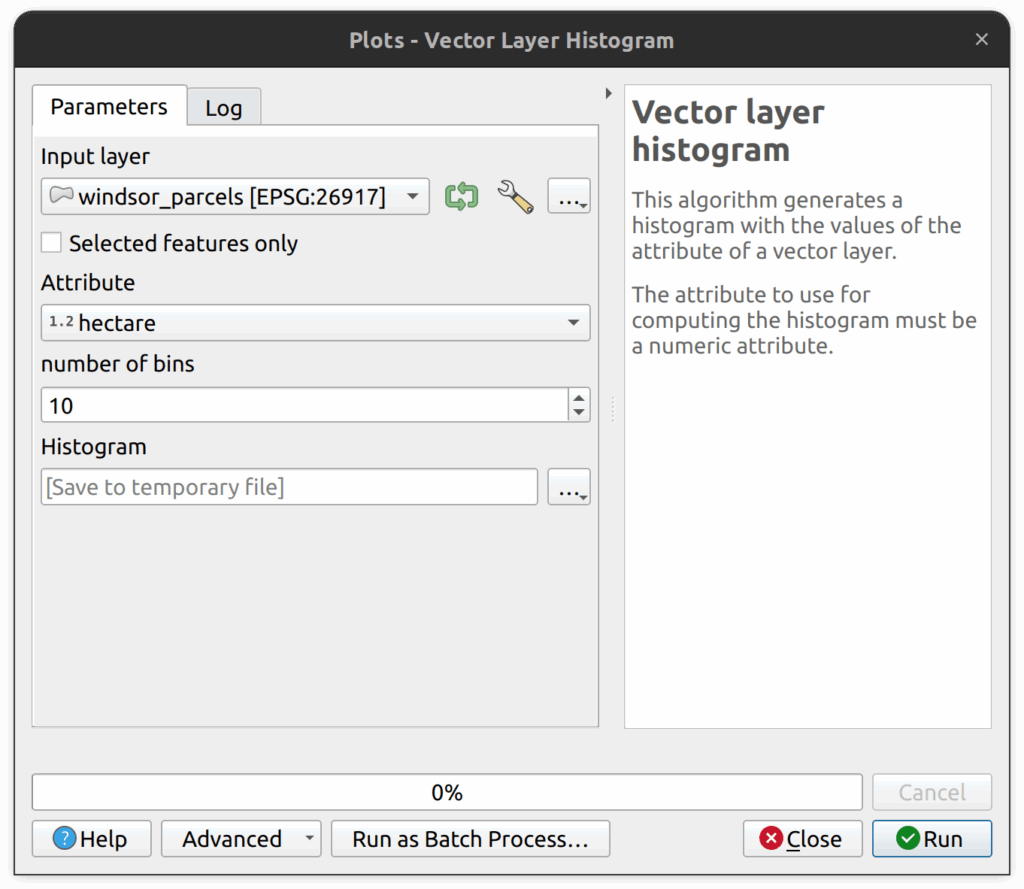
2. In the Processing panel, locate and open the Vector Layer Histogram tool. This tool can be used to export histograms generated from attributes data.
3. In the Vector Layer Histogram tool, enter the following parameters:
- Input layer: windsor_parcels layer
- Selected features only: checked
- Attribute: sqm
- Number of bins: 10
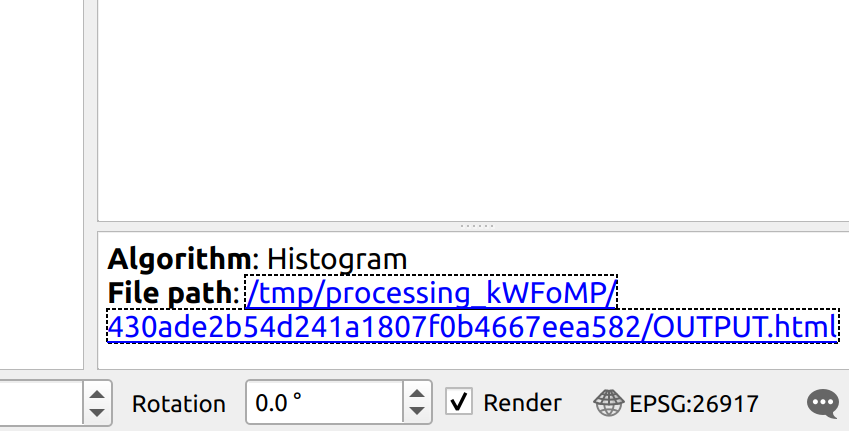
- You can either save the histogram (e.g. as a HTML file) or save is temporarily.
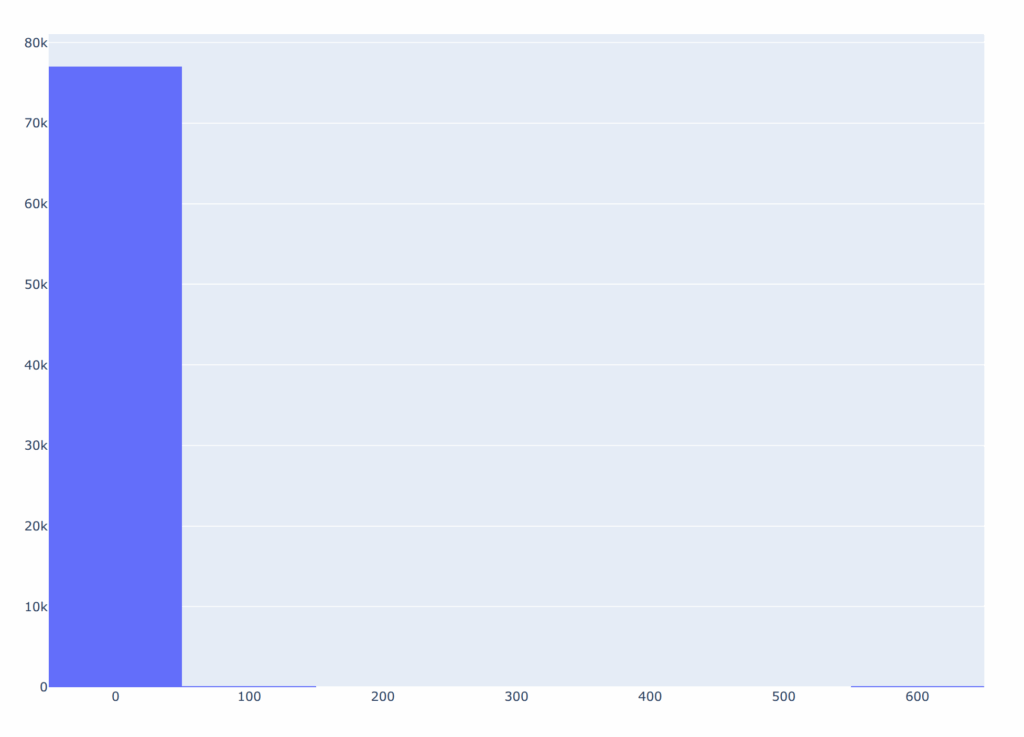
4. Once the tool executes, there will be a link to the file path on the bottom right of the screen. Click that link to open the histogram in your web browser.
10. Select by Location Tool
We can also select features based on their relationships to other features. In this example, we will determine how many parcels are within 1km of each community centre in Windsor, Ontario.
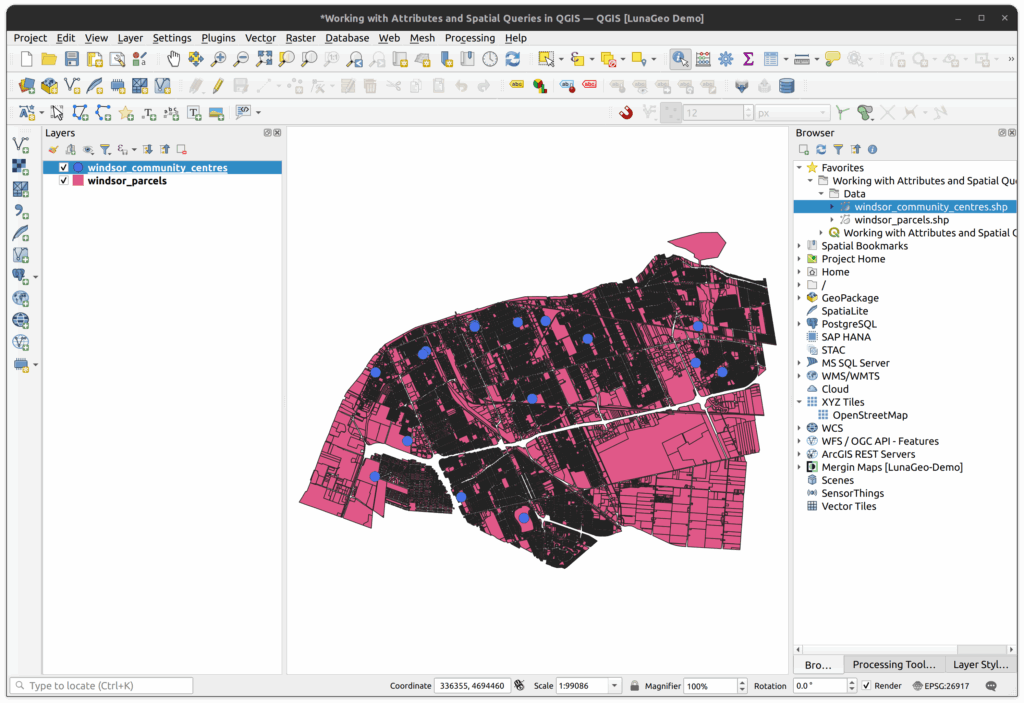
1. Add the windsor_community_centres layer to the map from the tutorial folder.
2. Change the symbology to contrast the colour of the windsor_parcels layer and make the points larger so they stand out.
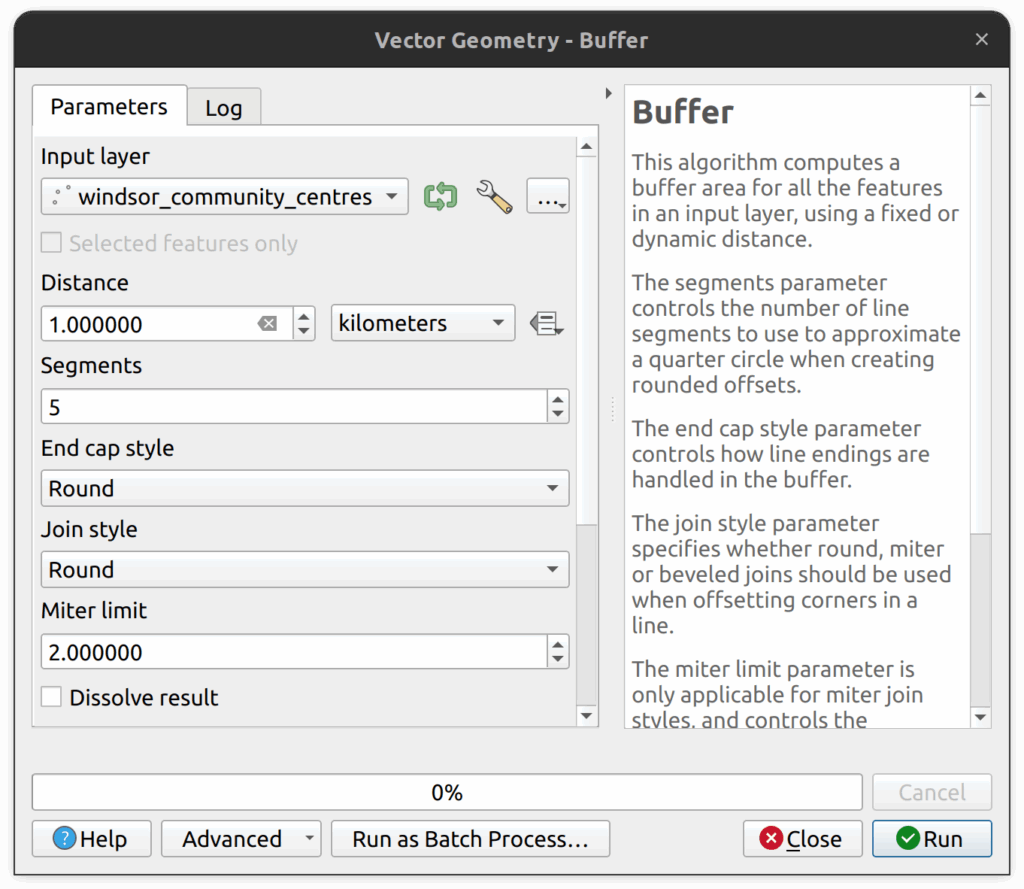
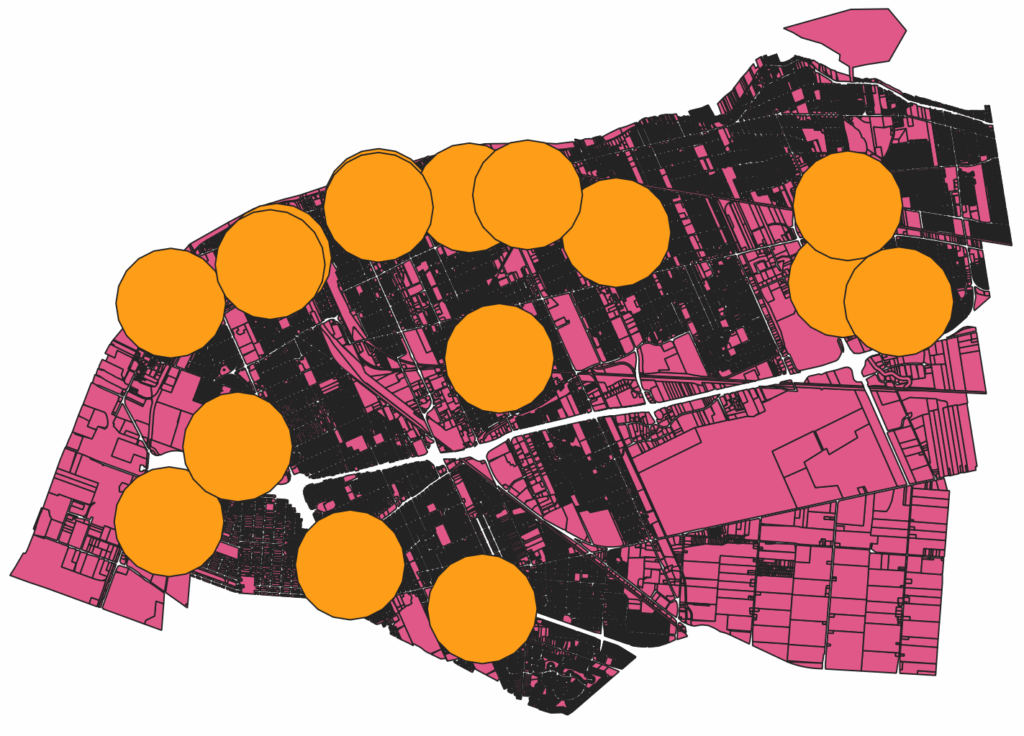
3. In the processing panel, locate and open the Buffer tool. We will use it to buffer the points by 1km.
4. In the Buffer tool, set the following parameters:
- Input layer: windsor_community_centres
- Distance: 1km
- Leave all other values as default
- You can either save the results as a shapefile or create a temporary layer.
- Click Run to execute the tool.
You should now see 1km circles around each community centre.
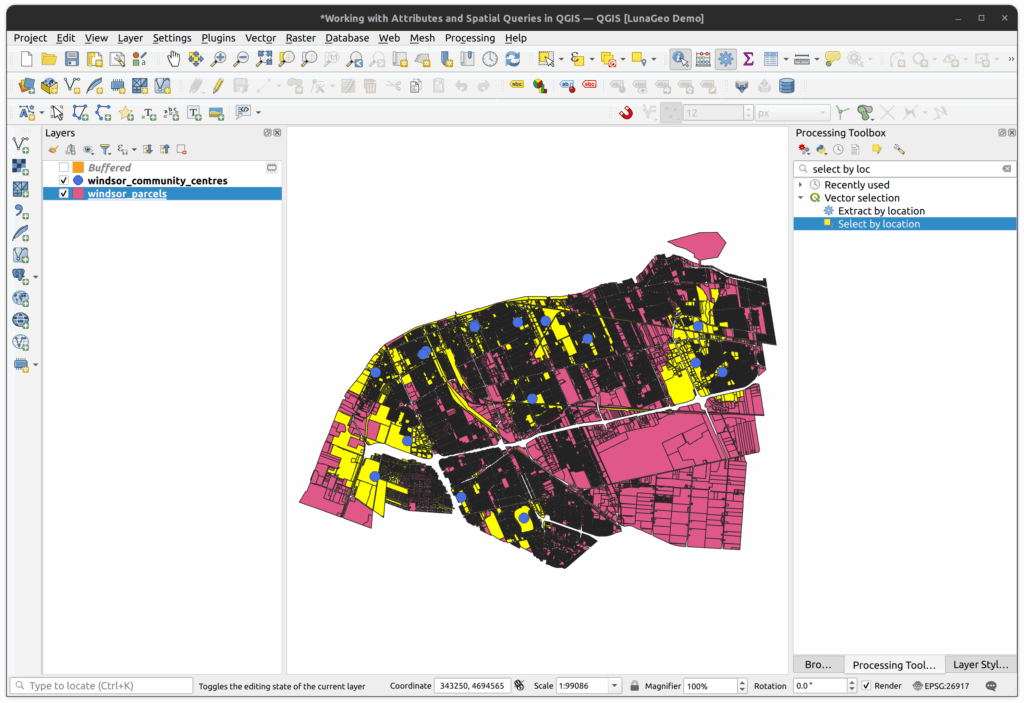
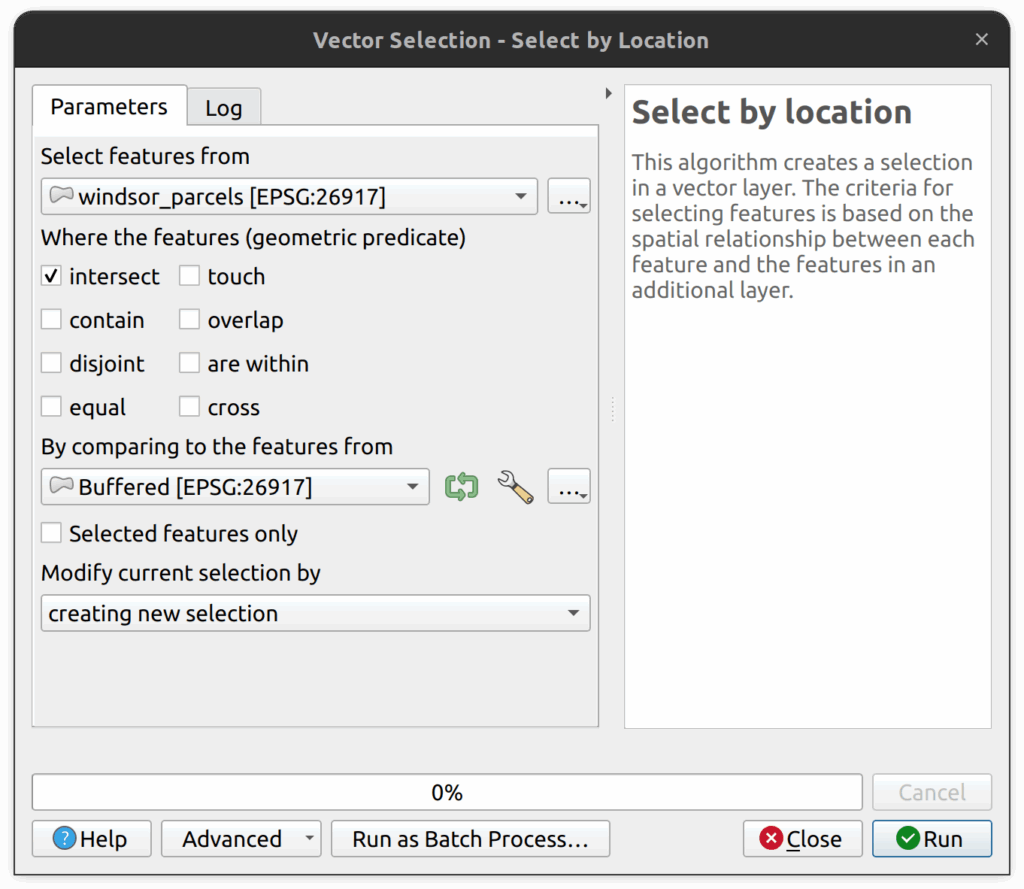
5. In the Processing panel, locate and open the Select by Location tool.
6. In the Select by Location tool, enter the following parameters:
- Select feature from: windsor_parcels
- Where the features: check Intersect
- By comparing to the features from: select the buffered layer just created.
- Modify current selection by: select “creating new selection” from the drop-down.
View the count at the bottom of your QGIS interface or open the windsor_parcels attribute table to determine how many parcels were selected. It should be 29,081.

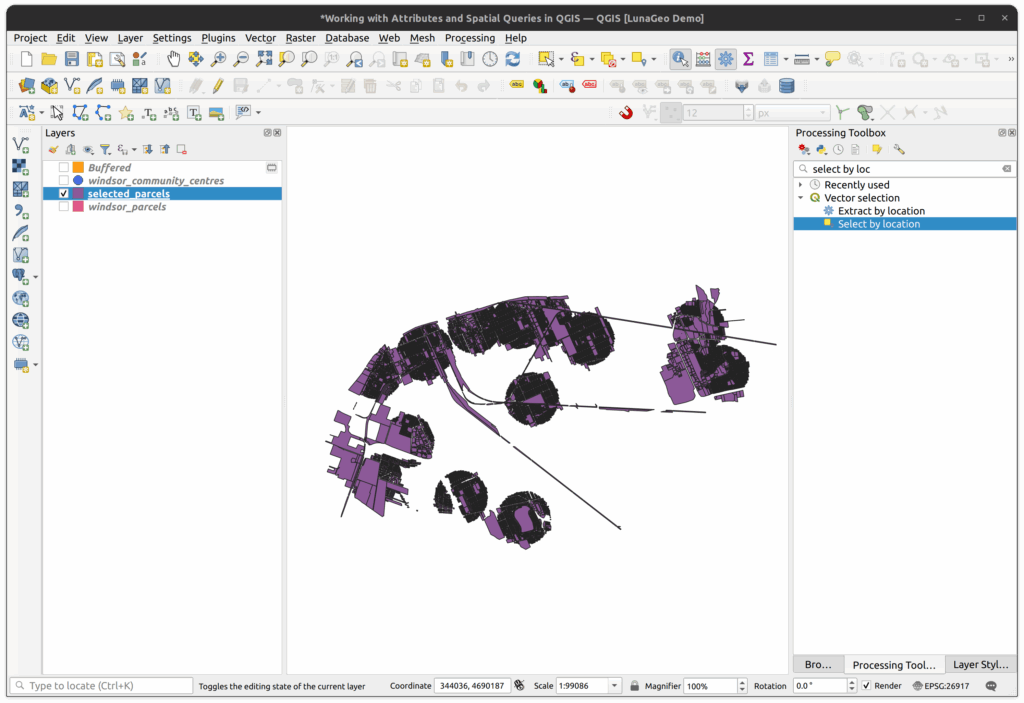
7. You will now export the selected parcels to a shapefile. In the Layers Panel, right-click on the parcel layer > Export > Save Selected Features as. Enter the following parameters:
- Format: ESRI Shapefile
- File name: save the file into the tutorial folder and call it selected_parcels.shp
- Make sure that “Save only selected features” is checked.
Click OK to save the file. It will load into the project automatically. You now have all the parcels that are within 1km of a community centre. This layer could be used for further analysis (e.g. what zoning types are within 1km of community centres?).