
Table Joins and Classification in QGIS
Summary
This tutorial focuses on working with attribute data in QGIS, including adding non-spatial tabular data to the attribute tables of geospatial layers to provide additional context and insight by using a data-driven layer styling pattern.
What You’ll Learn in this Tutorial
- Perform a table join in the Layer Properties – add a comma delimited data file to your geospatial features’ attribute table
- Create a new GeoPackage.
- Classify attribute data and update layer symbology accordingly to stylize layers by attribute data
- Export/import layer symbologies as files so they can be shared or reused later
- In this tutorial you will join tabular data to a polygon shapefile and export the layer as a GeoPackage to preserve the joined data.
Prerequisites
1. Create a New QGIS Project
- Open QGIS 3.x and set the project CRS to EPSG:26917.
- From the tutorial folder, load the shapefile canada_census_dissemination_areas_london.shp and census_data_2021_london.csv
- Examine the Attribute Tables and identify the common field (column) between them. Indeed, it is the DAUID field.
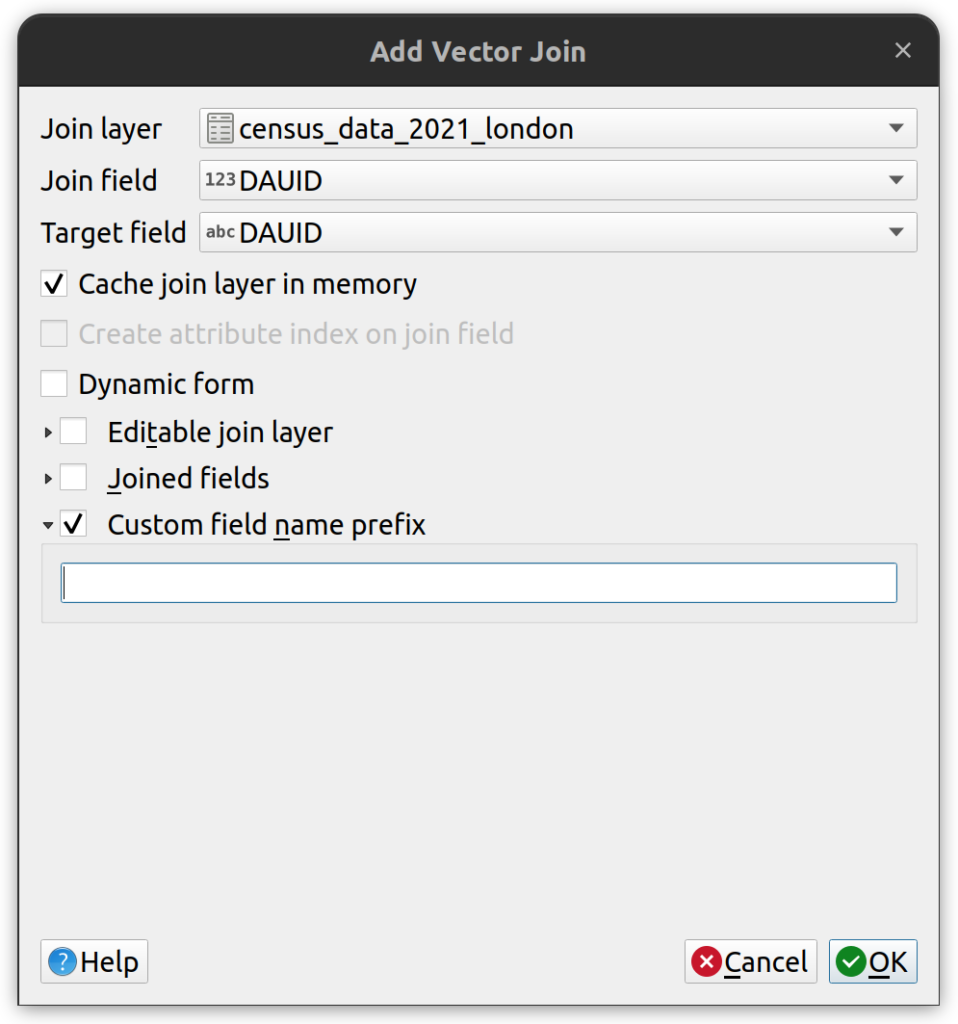
2. Joining a Layer with a Table
Create the join between both the layer and the CSV file:
- Open the Layer Properties of the canada_census_dissemination_areas_london layer.
- On the left side, select Joins.
- Click on the green plus button at the bottom to add the join.

- In the Add Vector Join dialog, select census_data_2021_london as the join layer.
- Select DAUID as the Join field.
- Select DAUID as the Target field.
- Select the Custom field_name prefix and remove the prefix.
- Click OK to make the join.
- Reexamine the attribute table of the canada_census_dissemination_areas_london layer. Note that the joined fields are now part of the attribute table.
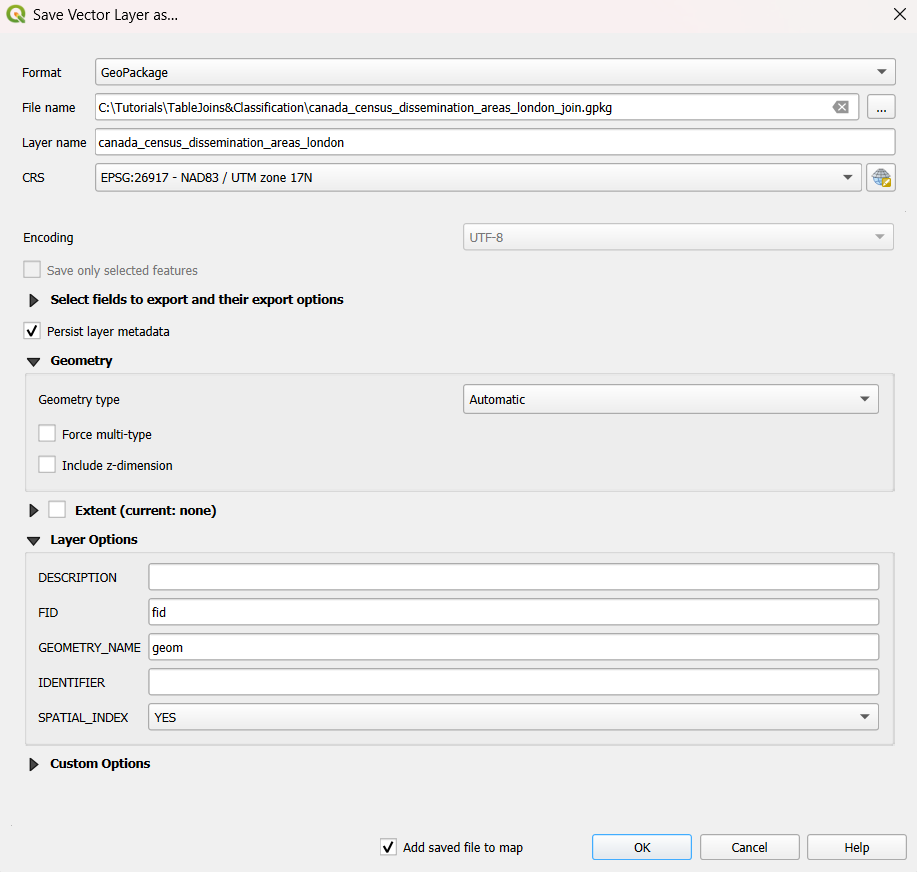
3. Make the Join Permanent
- Right-click on the polygon layer in the Layer Panel and go to Export > Save Features As… and export the layer as a Geopackage. Save it in the tutorial folder and call it canada_census_dissemination_areas_london_join.gpkg
- The new layer will be added to the map automatically.
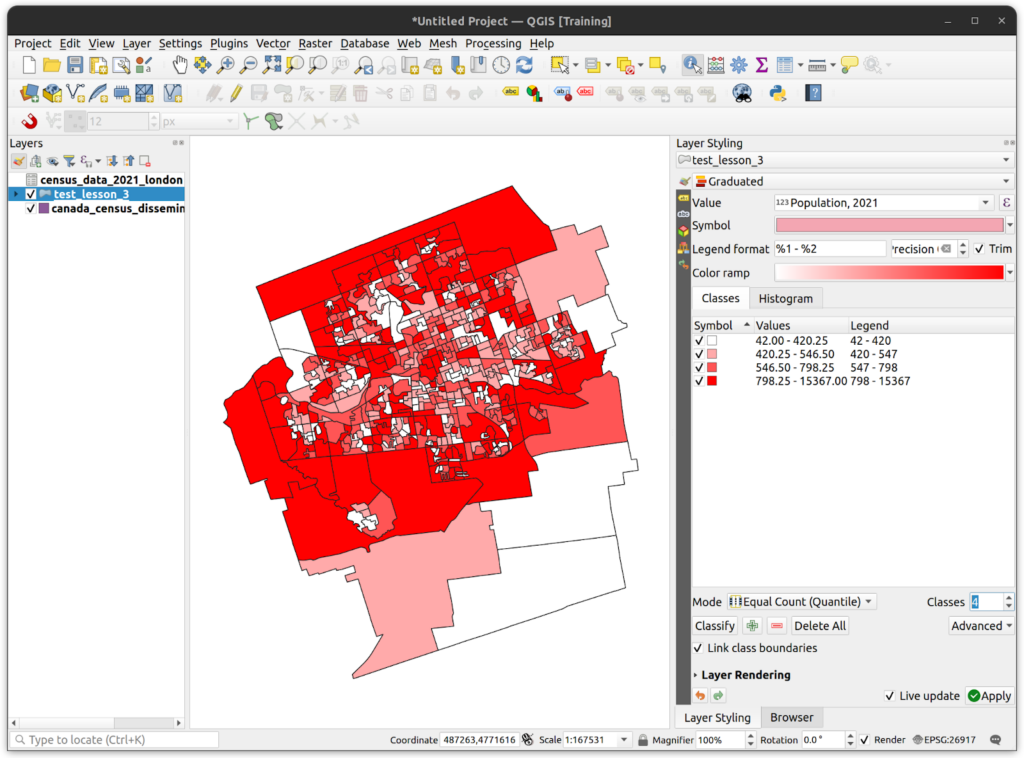
4. Classify by Total Population
- Open the Layer Styling panel and dock it on the right side of the screen.
- On the Layer Styling panel, change the symbology from Single Symbol to Graduated.
- Select the value Population, 2021.
- Click the Classify button.
- Change the number of classes to observe how the map changes dynamically.
- Change the classification mode from the default equal count (Quantile) to equal interval to observe the difference.
5. Export Symbology
Sometimes we want to export symbologies to share them with other users. In QGIS, it is possible to save symbology in two formats, Styled Layer Descriptor (SLD) format or the native QML format. Classify by population density:
- Change the colour ramp to white to red.
- Set the Mode to Equal Count.
- Set classes to 5.
- Click Classify.
- Open the layer properties, click on Symbology > Style > Save Style…
- Save the style as a QML file in the tutorial folder. Name it pop_density_style.qml.
6. Load the Style File in a New QGIS Project
- Create a new QGIS project.
- Load canada_census_dissemination_areas_london_join.shp and note that there is no style applied to the layer.
- Open the layer properties and click Style > Load Style… and select the QML file you created in step 10.f. Click Load Style and press OK. The style should be applied to the layer.
How can we help?
Contact us today to schedule a free consultation with a member of our team.