
NDVI Analysis in QGIS
This tutorial demonstrates how to conduct NDVI analysis in QGIS. Normalized Difference Vegetation Index (NDVI) is calculated from multispectral (multiband) rasters, which consist of multiple images captured at different wavelengths. You will learn how to combine spectral bands and perform raster calculations to generate NDVI rasters that are widely used to assess vegetation health, density, and spatial patterns across a landscape.
What You’ll Learn in this Tutorial
- Display a composite band image in QGIS
- Gain a conceptual and practical understanding of the Raster Calculator tool for calculating a band ratio
- Compute the Normalized Difference Vegetation Index (NDVI) from a Sentinel-2 satellite image
- Determine the greenest planning district in London, Ontario using NDVI on a Sentinel-2 image from July 9, 2019
Prerequisites
1. Create a New QGIS Project
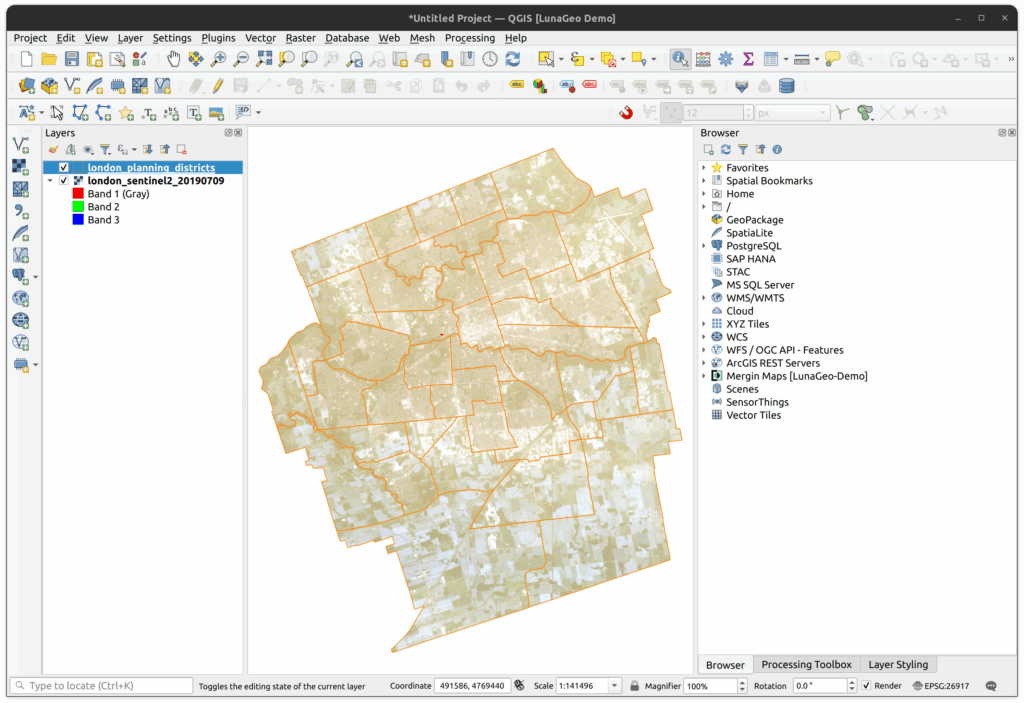
1.1. Expand the tutorial directory and load the raster london_sentinel2_20190709.tif
1.2. Inspect the raster’s Layer Properties. Note that there are 5 bands in the image. These bands are defined as follows:
- Band 1: Blue
- Band 2: Green
- Band 3: Red
- Band 4: Visible and near infrared (VNIR) (Sentinel Band 8).
- Band 5: Alpha – this is the transparency band.
1.3. Add the London Planning Districts layer to the map and apply an outline sybmology so we can see the raster underneath.

2. Experiment with Spectral Band Combinations
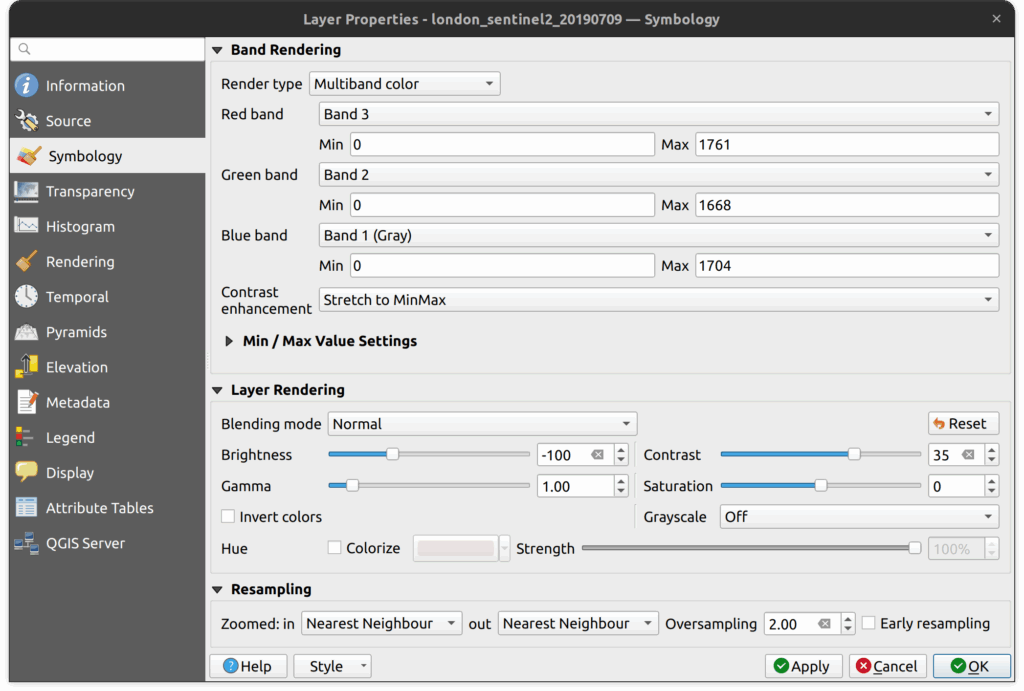
2.1. To display the image as a true colour composite, in the symbology set the red band to band 3, the green band to band 2, and the blue band to band 1. Click OK.
2.2. It looks better, but a little hazy. Open the properties and adjust the brightness and contrast until the image looks sharper. Setting the brightness to -100 and the contrast to 35 produces a good result.
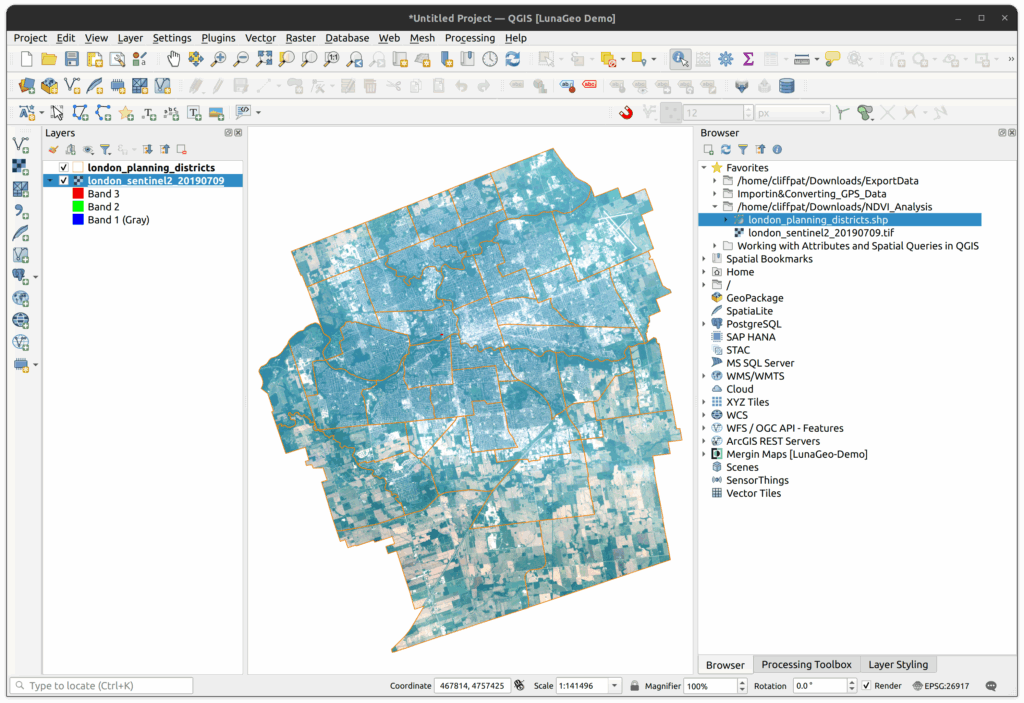
2.3. To view the raster as a colour infrared, change the red band from band 3 to band 4 (the VNIR band) and click OK. Notice that vegetation “pops” when using the VNIR band.


3. Compute the Normalized Difference Vegetation Index (NDVI)
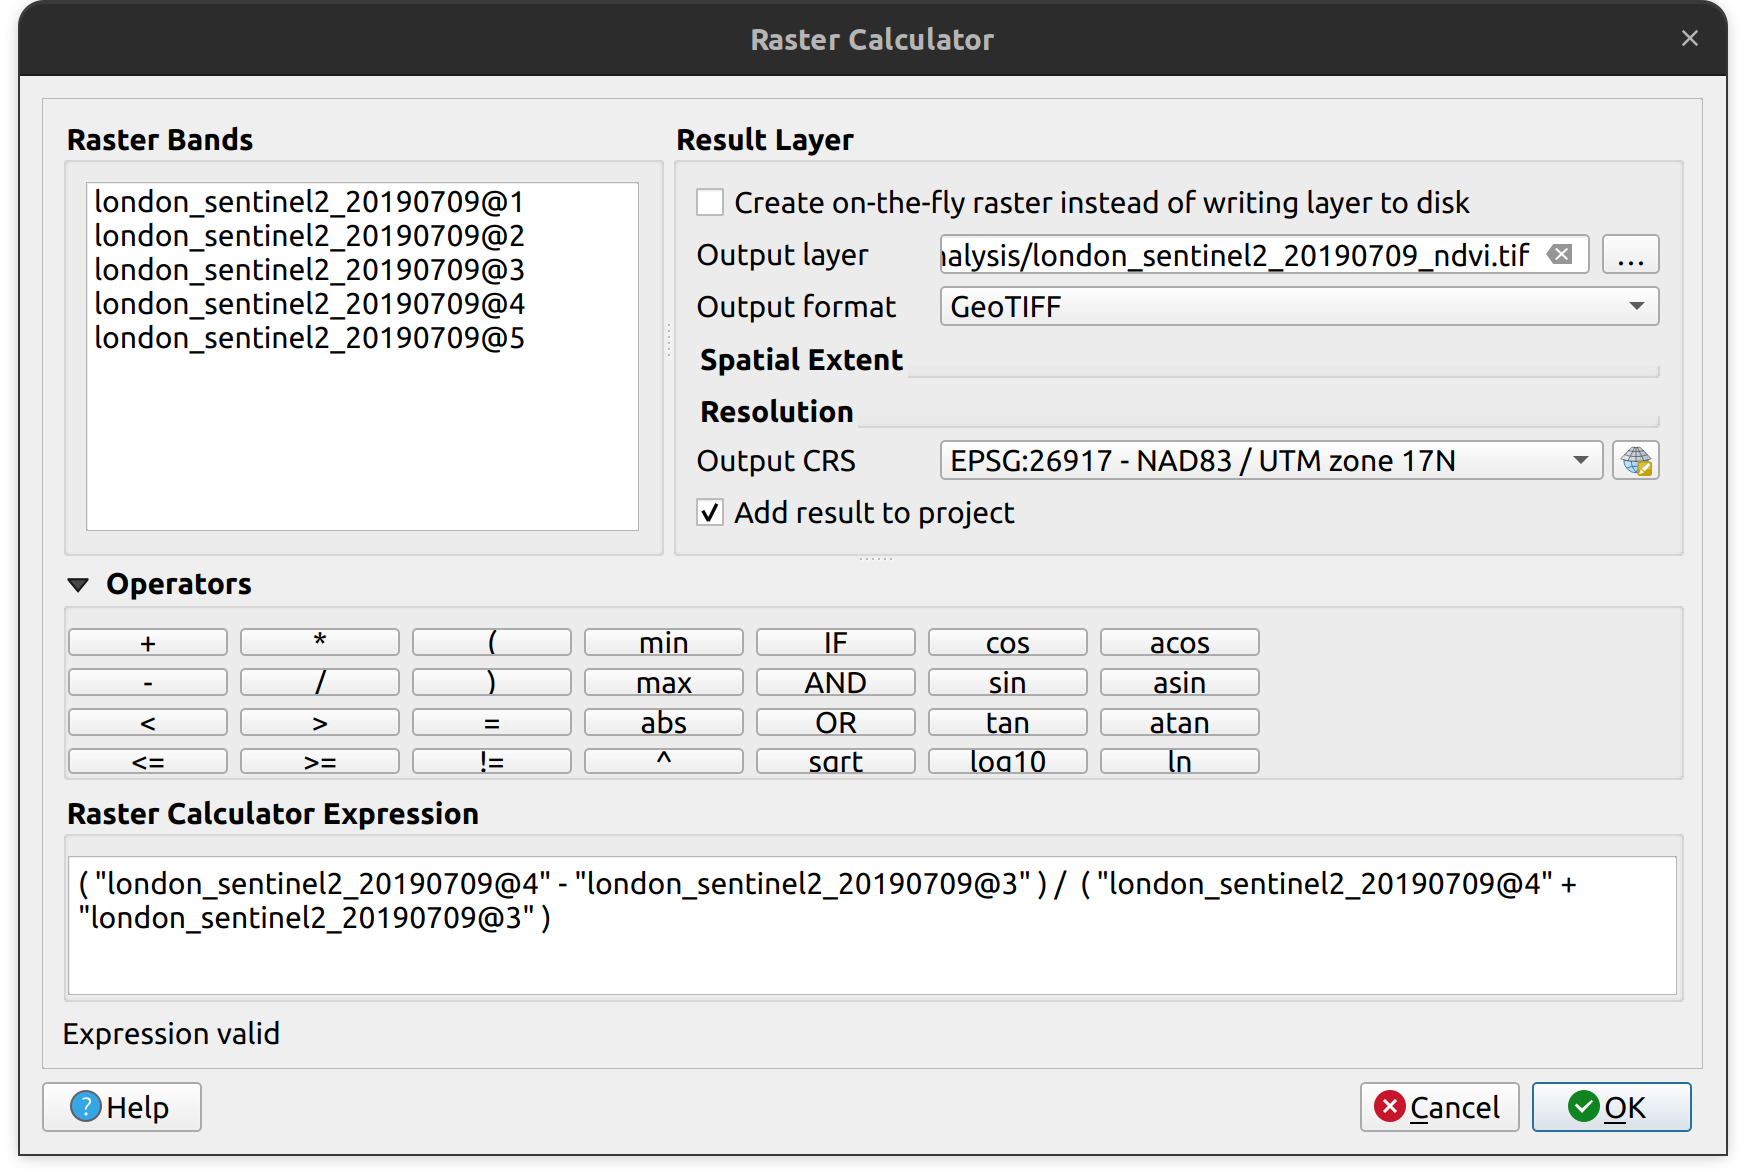
3.1 Open the raster calculator (main menu > Raster > Raster Calculator…) and enter the following formula by double clicking on each band:
( "london_sentinel2_20190709@4" - "london_sentinel2_20190709@3" ) / ( "london_sentinel2_20190709@4" + "london_sentinel2_20190709@3" )3.2 For newer versions of QGIS, you may need to specify the Reference layer(s). Use the london_sentinel2_20190709.tif layer for this.
3.3 Save the result as london_sentinel2_20190709_ndvi.tif
3.4 Save the QGIS project to the tutorial folder.
3.5 Use the Identify tool to examine the NDVI image. Also change the symbology to pseudocolor with a white to green colour ramp.
4. Compute Zonal Statistics from the NDVI Image
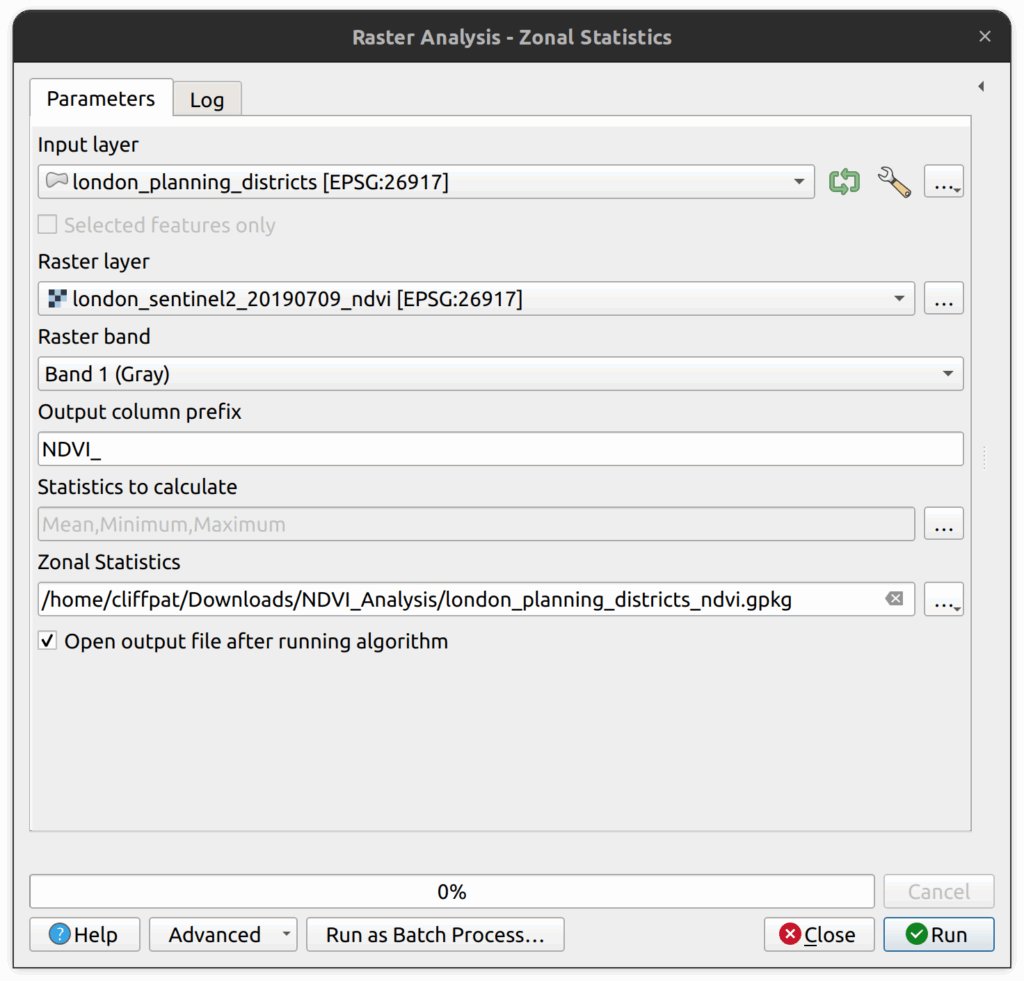
4.1. Now we will compute the minimum, maximum and mean NDVI values for each planning district in London, Ontario. To do so, we will use the Zonal Statistics tool. Find the tool in the Processing toolbox and double click on it. Set the following parameters:
- Input layer is the London Planning Districts.
- Raster layer is the NDVI image.
- Raster band is band 1.
- Output column prefix is NDVI_
- Select mean, minimum and maximum as the statistics to compute.
- Save the output as a GeoPackage with the name london_planning_districts_ndvi.gpkg
4.2. Click the Run and Close when complete.
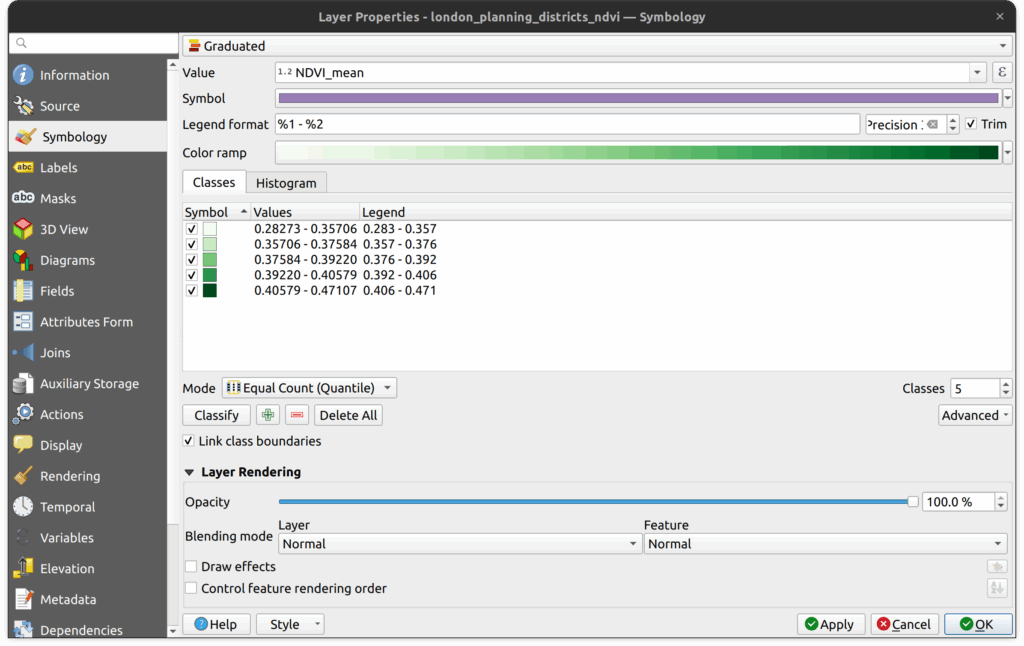
5. Visualize the NDVI Statistics Layer
5.1. Create graduated symbology with a white-to-green colour ramp to identify greenest districts.
5.2. Save the project to the tutorial folder.
5.3. Inspect the new vector layer:
- Why are some areas the lowest? What is the dominant land cover class?
- What is the dominant vegetation type in the greenest areas?
- What is the dominant vegetation type in the medium areas (especially in the southern part of the city)?

How can we help?
Contact us today to schedule a free consultation with a member of our team.