
Display and Interact with Geospatial Data using QGIS
Summary
This tutorial provides a mini example of a geospatial project workflow in QGIS including loading geospatial data into a QGIS project, modifying the appearance of map layers appearance and creating and saving a map document output. This will further introduce you to the QGIS interface in a practical way, and teach you about other dialogs and interfaces you will work frequently with including the Layer Properties dialog and the Layout Manager.
What You’ll Learn in this Tutorial
- Navigate the QGIS Browser Panel to manage project data
- Change the Coordinate Reference System (CRS) for a project
- Modify layer appearances, including symbology and labeling
- Use the QGIS Layout Manager to create and export map documents
- Load and style multiple layers
- Create a map of planning districts and wooded areas in London, Ontario
- Export the final map layout as a PDF using the Print Manager tool
Prerequisites
1. Create a new QGIS project
1. Open QGIS 3.x and make sure the Browser panel is open
2. Using the Browser panel, navigate to the tutorial files.
3. Expand the tutorial folder so you can see the contents.
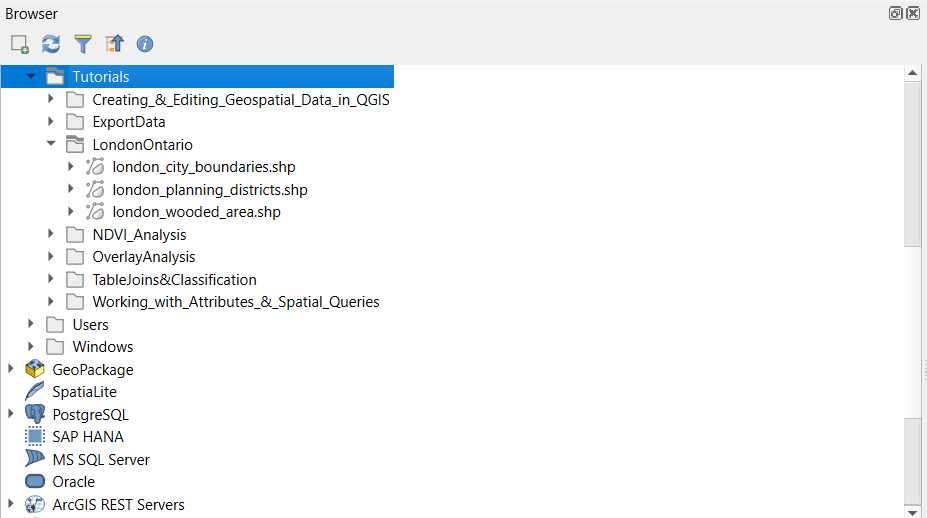
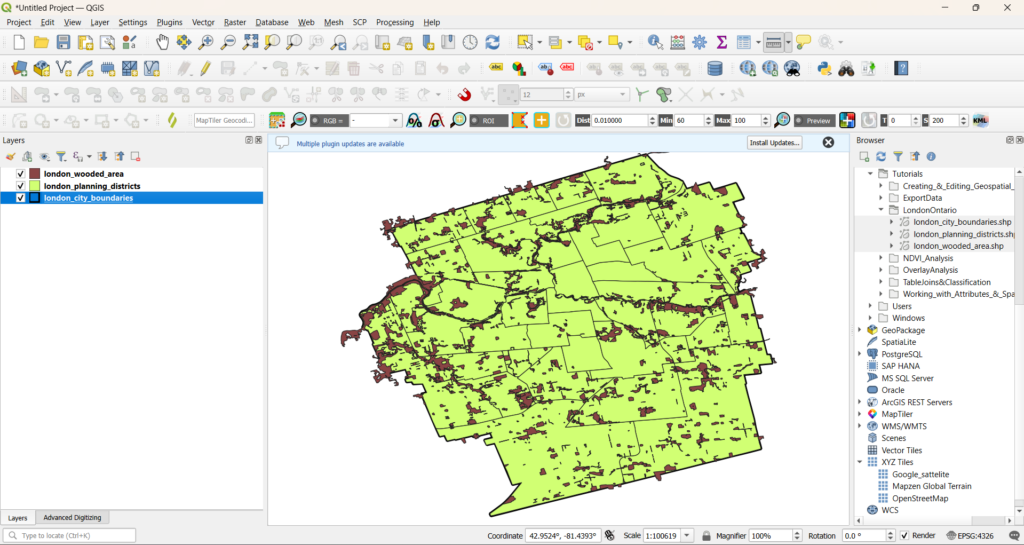
4. Add the three shapefiles to the map by dragging them to the map canvas, or select all three by holding CTRL and add them all at once.
5. You will see a Select Transformation… dialog box appear. Select OK to continue.
6. Save the QGIS project. On the top menu, click Project > Save As and save the project inside the tutorial folder.
8. Change the Project CRS to EPSG:26917 (NAD 83 UTM Zone 17N) by clicking on the bottom right button that shows the current project CRS.
2. Explore Each Layer
- Right-click on any of the layers in the Layers panel and select Properties…

- What is the CRS?
- What is the Geometry type?
- How many features are in each?
3. Change the Symbology for Each Layer
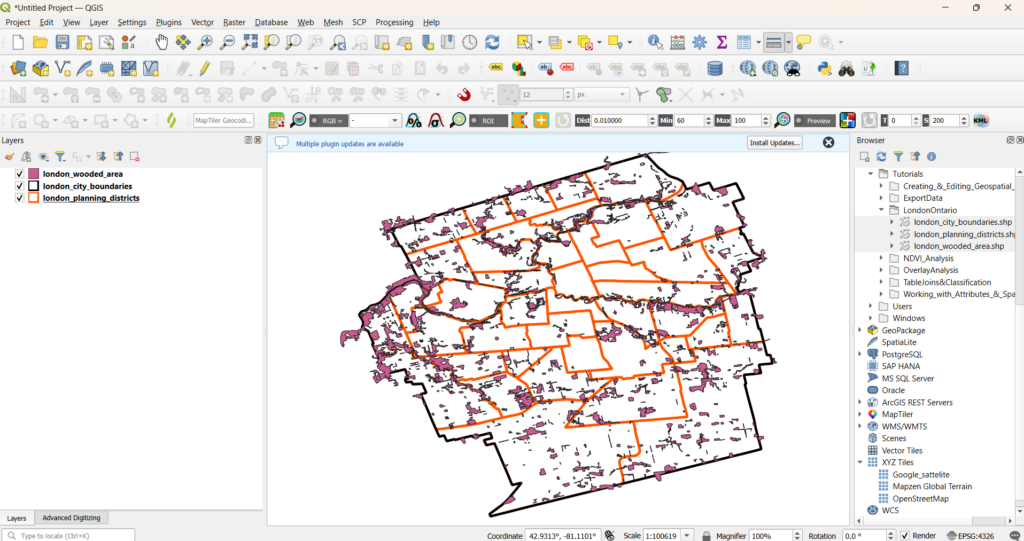
- In the Layer Properties, change the symbology for the City Boundary layer. Click on Simple Fill and change the Symbol layer type to Outline: Simple Line. Set the colour to black, and the stroke width to 0.5mm.
- Change the symbology for the Planning Districts layer. Make it an Outline: Simple Line, set the colour to orange and the stroke width to 0.25mm.
- Change the layer order in the Layers Panel so the City boundary is on top of the Planning Districts.
4. Label the Planning District Layer
- Use the Identify tool on the Planning Districts layer to determine the best field to use as the label.
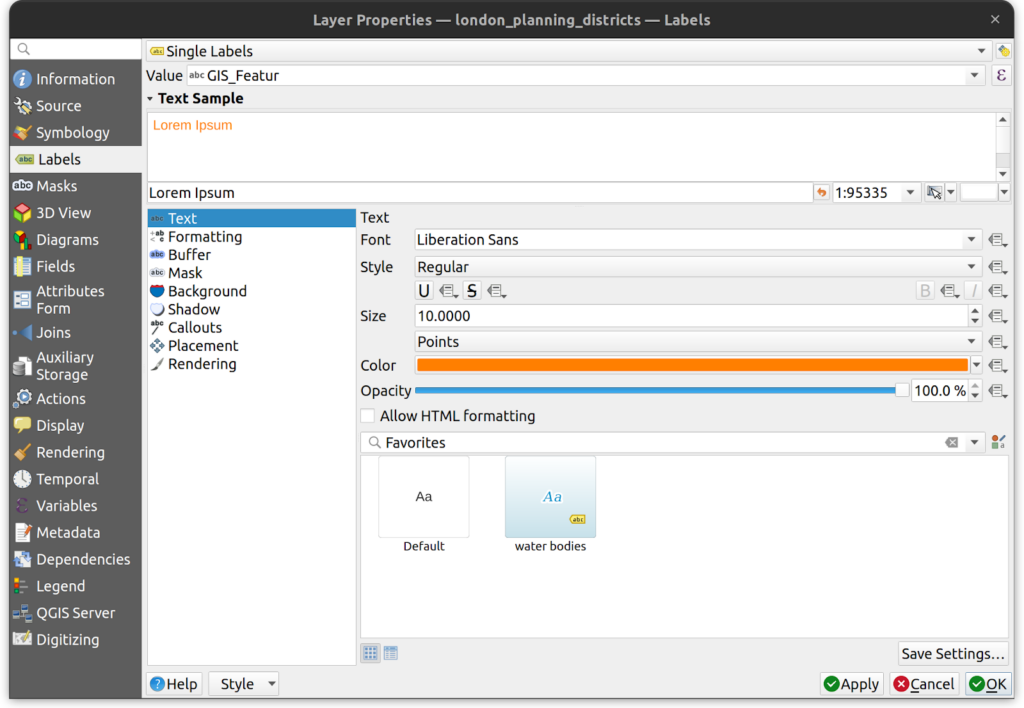
- Add text labels to the Planning Districts. Open the Layer Properties and select the Labels tab. Set the Value to GIS_Featur, make them the same orange as the outline symbology and make the font size 10.
5. Style the Wooded Area layer by area_type
- Open the Attribute Table for the Wooded Area layer. Note that there is an AREA_TYPE field. Sort the table by that field and note the different types of wooded areas. Exit the Attribute Table.
- Change the symbology of the Wooded Area layer.
- Using the drop down menu at the top of the Symbology options, select Categorized and for the value select the AREA_TYPE field.
- Click the Classify button to see the categories.
- Remove the “other” class by un-checking the box to the left and select a colour for each class (e.g. light green to dark green).

3. Save the QGIS project to the tutorial folder. Name it IntroToQGIS and hit save.
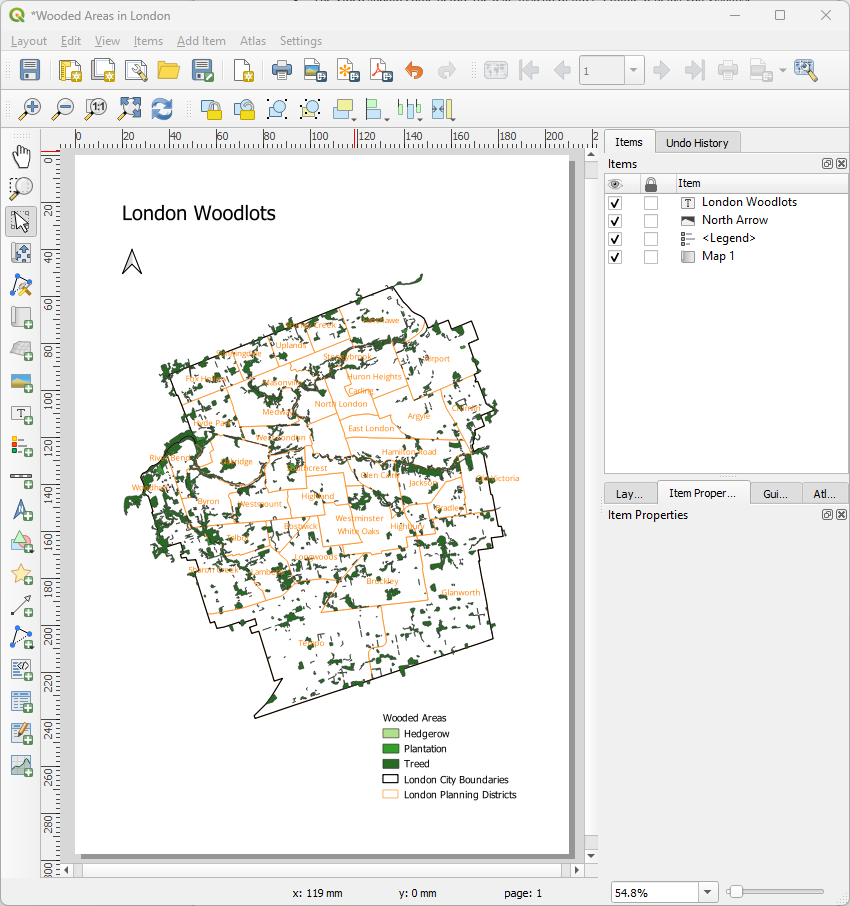
6. Create a Print Layout
- Open the Layout Manager on the main toolbar .
- Select Create and give the new layout a name (e.g. Wooded Areas in London).
- Change the page layout to Letter Portrait by right clicking the page and selecting Page Properties. In the Item Properties on the right, select Portrait from the Orientation dropdown menu.
- Add the map to the layout using the Add Map button . Adjust the size as needed. With the map selected, change the scale to 150,000 in the Item Properties tab on the right.
- Add the legend using the Add Legend button .
- On the Legend Properties, deselect the “Auto Update” option.
- Select each item and edit the label to make it more readable.
- Change the wooded area layer name to “Wooded Area Type”
- If showing, remove the unlabeled “other” vegetation type by selecting it in the Legend Items pane and clicking Remove.
- Add a north arrow .
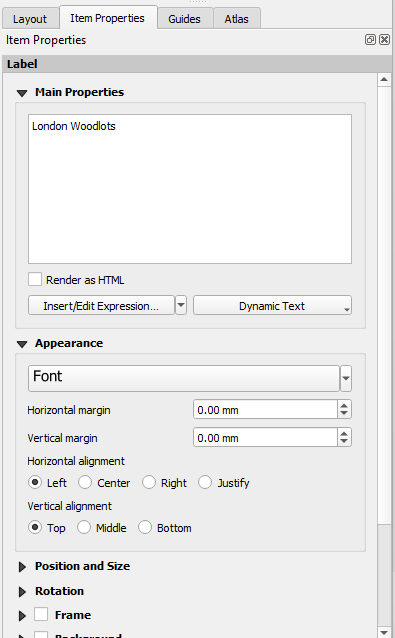
- Use the Add Label button to insert a textbox and give the map a title by typing in the Item Properties on the right. A good map title usually describes the location and topic, for example “London Woodlots”.
8. Save the map layout.
9. Export the map as a PDF. Go to Layout > Export as PDF to save the map as a PDF.
7. Save the QGIS Project
- Click the Save button on the top toolbar.
- Alternatively, on the top menu, click Project > Save.
How can we help?
Contact us today to schedule a free consultation with a member of our team.