
An Overview of the QGIS Interface
This tutorial will provide an overview of the QGIS interface and how to interact with it. You will load some demo data into the QGIS interface, style a layer, and interact with features.
What You’ll Learn in this Tutorial
- How to open and interact with a map in QGIS.
- Familiarize yourself with the QGIS interface, including menus, toolbars, panels, the status bar, and the map canvas.
- Load, save, and interact with a map project in QGIS using various features of the QGIS interface.
Prerequisites
1. Opening QGIS for the first time
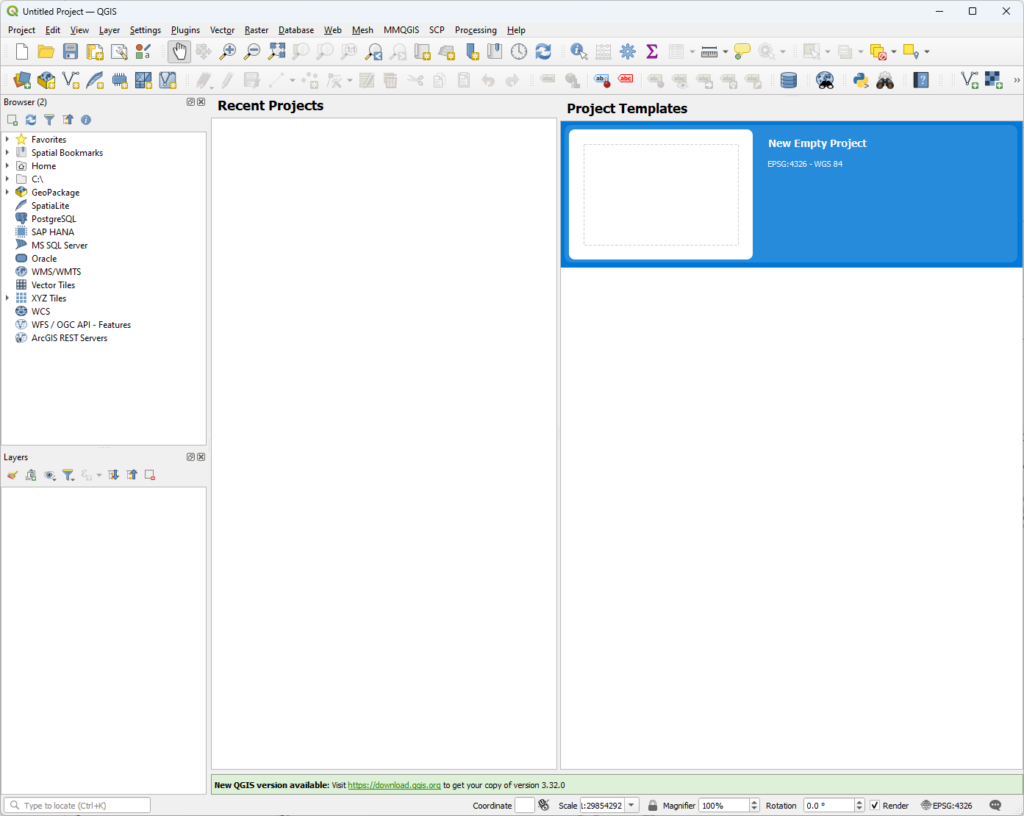
When you open QGIS for the first time, you will see a number of panes, such as “Recent Projects”, “News” or “Project Templates”. Begin by selecting “New Empty Project” to open a new QGIS project.
2. The QGIS Interface
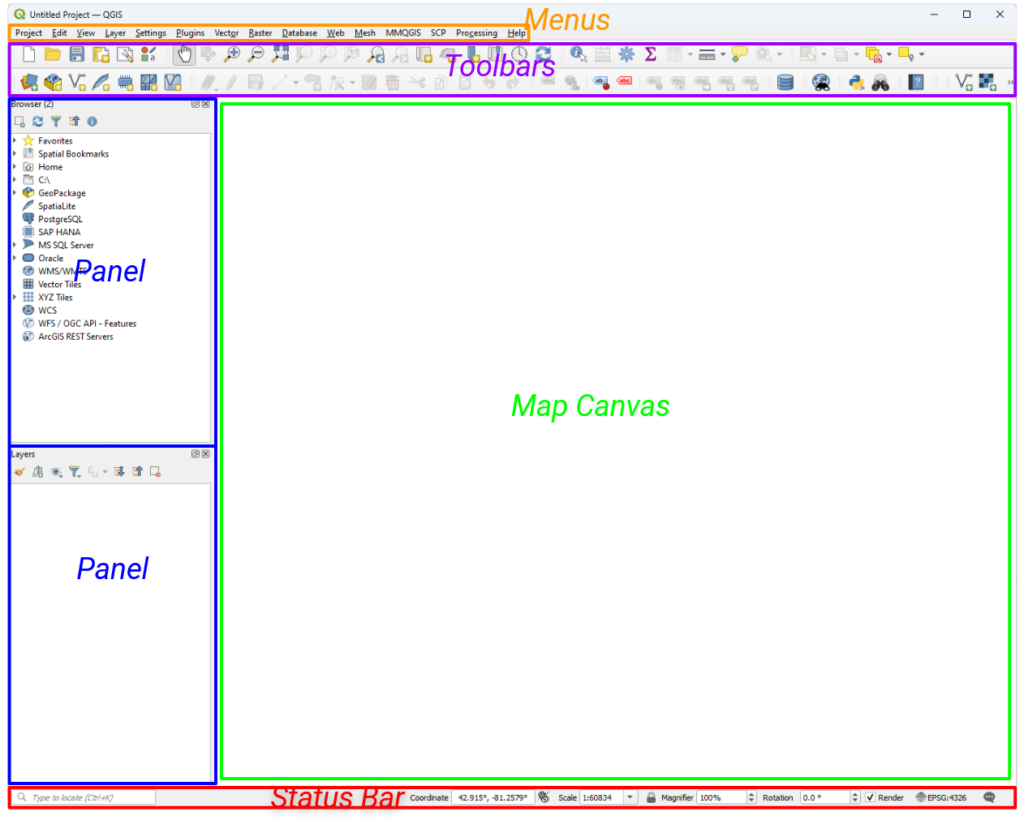
Beginning at the top of the QGIS interface, you will see the QGIS Menu Bar, where you can open menus that allow you to interact with QGIS projects, files and data, customize the QGIS interface and options, open tools and more.
Below the Menu Bar, you will see a number of Toolbars with icons on them corresponding to many of the functionalities available in the Menu Bar and more. For instance, on the top leftmost toolbar (known as the Project Toolbar), you will see icons corresponding to some of the Project Menu functionalities including “New Project”, “Open Project”, “Save Project” and more.
Docked on the left hand side of the QGIS Interface are two Panels called “Browser” and “Layers”. There are many other Panels, which provide places to interact with data and access tools.
Running along the bottom of the QGIS Interface is the Status Bar, which contains a search tool known as the Locator Bar and the Map Canvas controls.
Finally, in the centre of the QGIS Interface is the currently blank Map View (A.K.A. Map Canvas), where later on you will visualize and interact with spatial data.
3. Interacting with the QGIS Interface
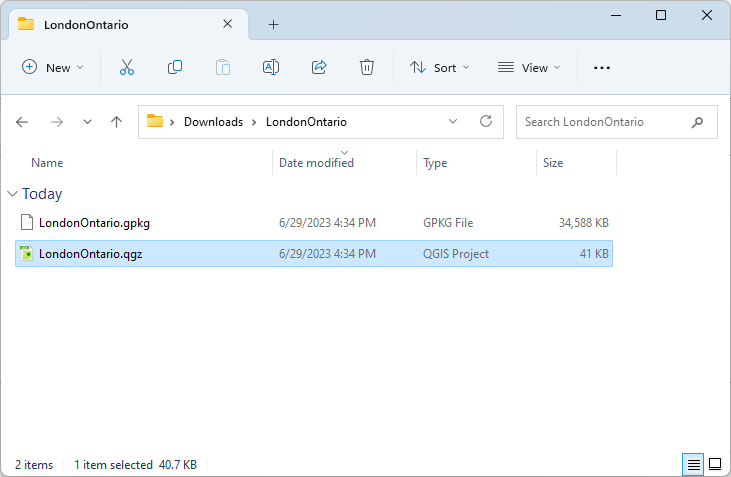
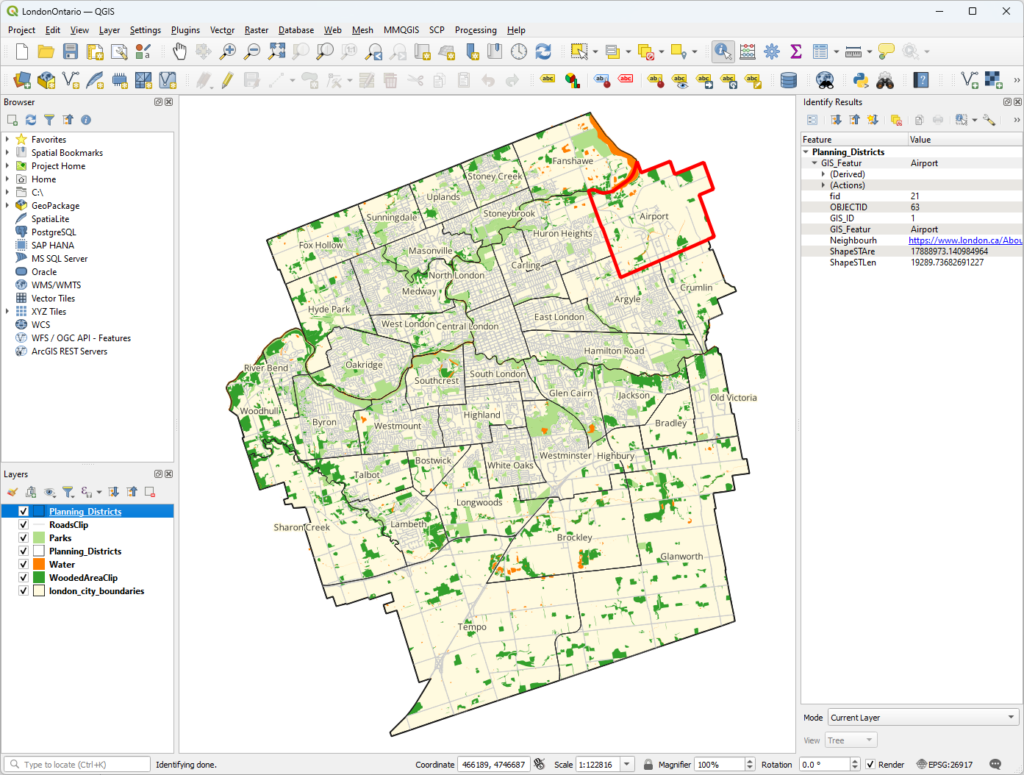
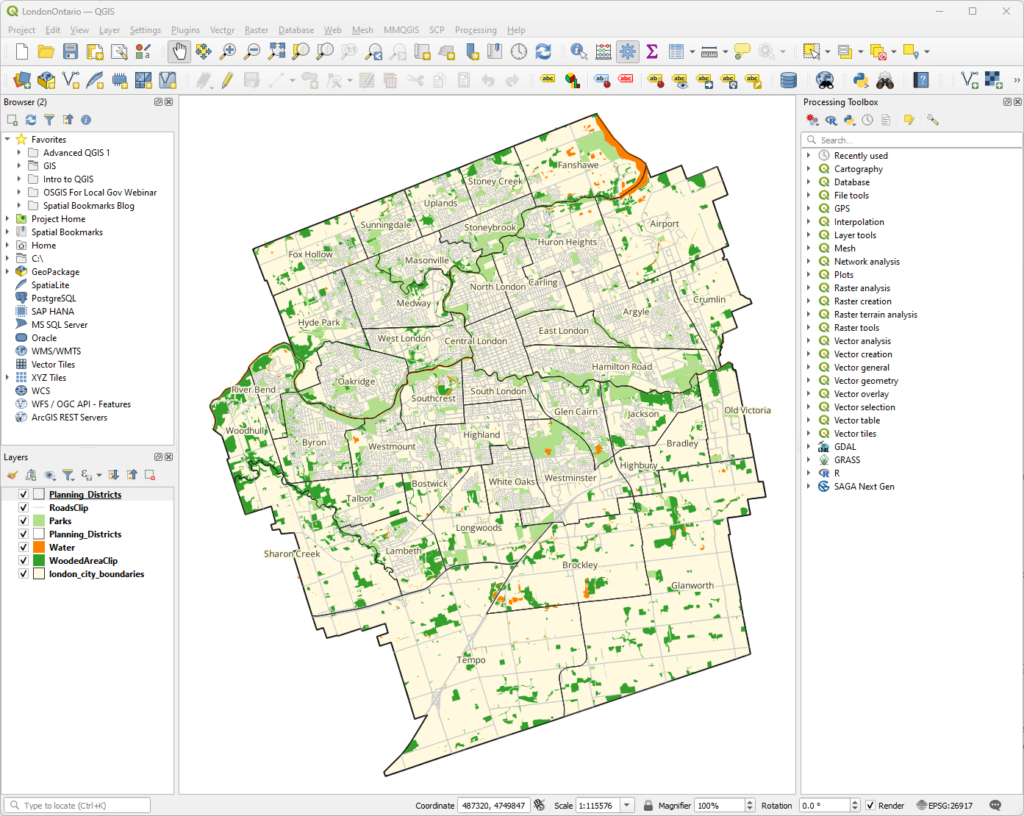
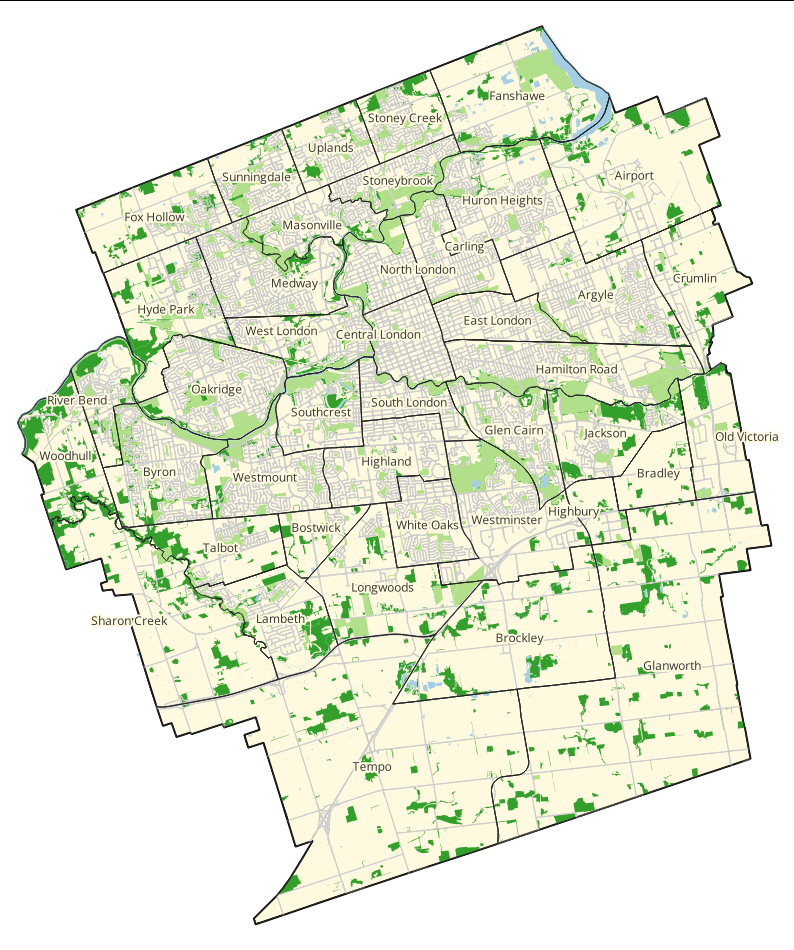
Start by interacting with each part of the QGIS Interface introduced in the previous step. On the Menu bar, go to Project > Open. Navigate to the folder in which you downloaded and unzipped the tutorial data, and click on the LondonOntario.qgz to open.
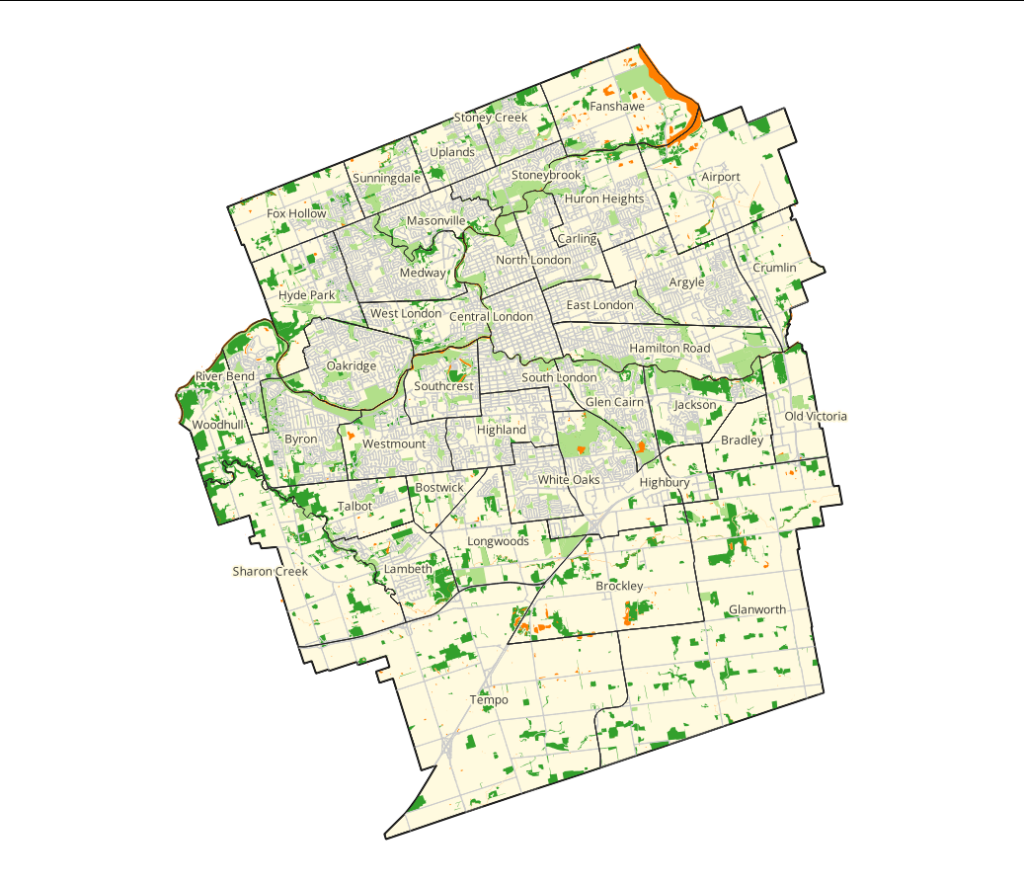
You should now see a map of the City of London, Ontario:
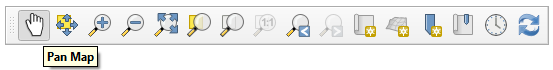
Next, take some time to get familiar with the tools on the standard toolbars. Start by using the Pan Map, Zoom In and Zoom Out on the Map Navigation Toolbar to interact with the map on the Map Canvas. You can also use the scroll wheel on your mouse to zoom in and out.
Use the Identify Features tool on the Attributes Toolbar to open the attribute table of the identified feature, such as a London neighbourhood.
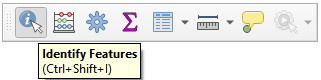
(Tip: the Identify Features tool will open the attribute table of whichever map layer is selected in the Layers Panel by default. To view the attributes of features in a different layer, left click on that layer in the Layers Panel)
Both the Toolbars and Panels in QGIS can be rearranged to suit your preferences. To move a Toolbar, click the grey column of dots that divides each Toolbar and drag to dock or rearrange. Click in the grey space at the top of each Panel and drag to dock or rearrange.
Further, Toolbars and Panels can be removed or added to the QGIS Interface as needed or to suit your preferences. To add or remove Toolbars or Panels, go to View on the Menu Bar, then find Panels at the bottom to expand the full list of panels. Similarly, find Toolbars at the bottom of the View Menu to find a full list of toolbars. Alternately, try right-clicking in the grey space above or next to any Toolbar or Panel to access the full list of Panels and Toolbars.
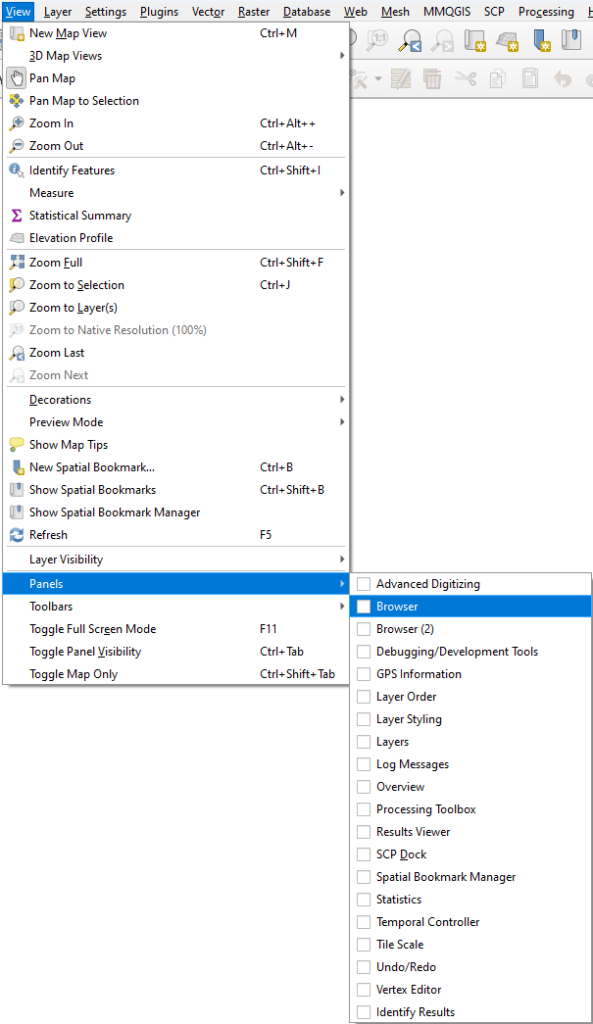
Try adding the Processing Toolbox Panel to the interface. It should appear docked to the right side of the QGIS Interface by default.
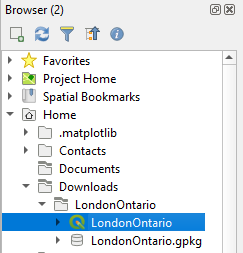
The Browser Panel provides a window into your computer’s drives and files, enabling you to add, delete and otherwise organize files and data right in the QGIS Interface. Try locating the tutorial data in the Browser Panel.
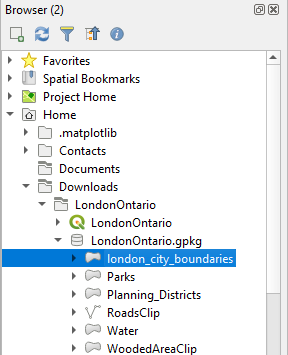
You can also add data to a QGIS project directly from the Browser panel. Try expanding the LondonOntario.gpkg folder, and adding one of the layers to the project again by left clicking, then dragging and dropping the layer onto the Map Canvas.
In the Layers Panel you can change how layers on the map appear. Firstly, you can rearrange the drawing order of map layers. For example, if you just added the london_city_boundaries layer to the map again, it likely covered up all the other map features because it is currently drawing first. Move the layer to the bottom of the drawing order by selecting it in the Layers Panel and dragging and dropping it below the other layers.
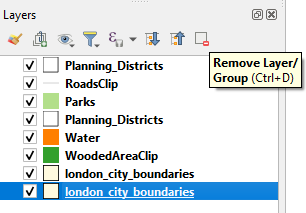
Alternatively, you can turn the visibility of layers off without removing them from the project by unchecking the box beside the layer name. But since we do not need a duplicate layer in this example, we can remove it from the project entirely by left clicking the layer in the Layers Panel, and pressing the Remove Layer/Group button on the top right.
Finally, notice as you move your cursor over the Map Canvas, the coordinates (in this case Easting and Northing) of your cursor is shown on the right side of the Status Toolbar located at the bottom of the QGIS Interface. You can also zoom in or out on the map by decreasing or increasing the Scale

4. Interacting with Layers
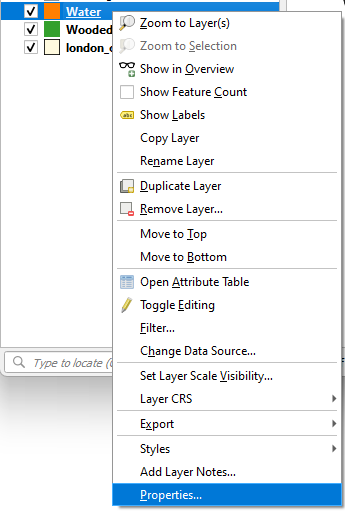
You may have noticed the water features on this map are drawn in a bright orange instead of a more intuitive blue. Lets fix this by changing the appearance of the layer. In the Layers Panel, right-click the water layer to open the menu, and at the bottom of the menu, open the Properties…
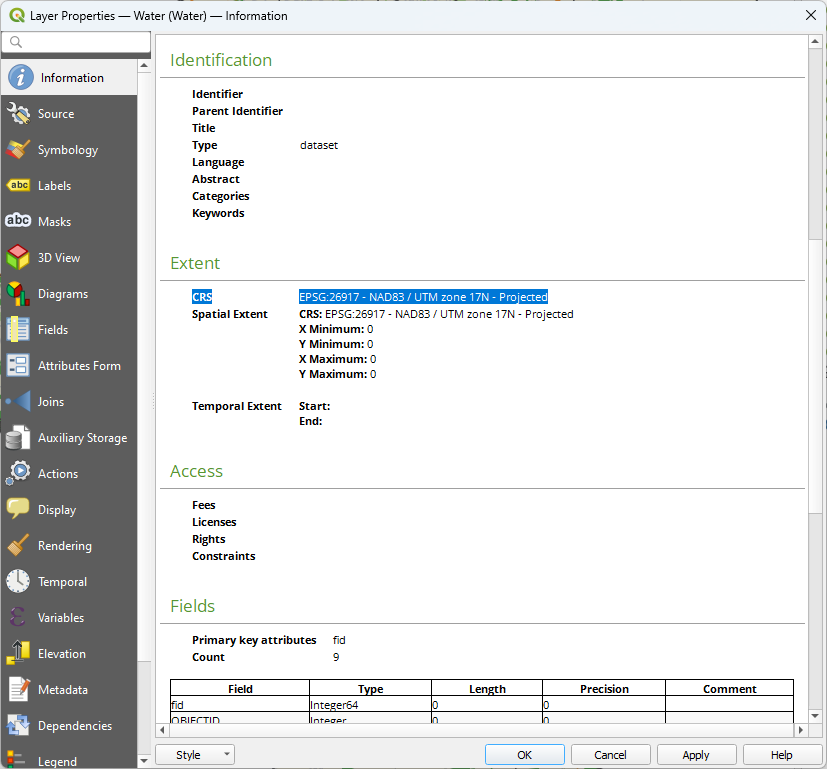
The Layer Properties Dialog will appear. Here, you can view and edit information about the layer, and change the appearance of the layer. Begin by selecting the Information on the left. In this tab you can view information about the layer, such as the CRS (Coordinate Reference System).
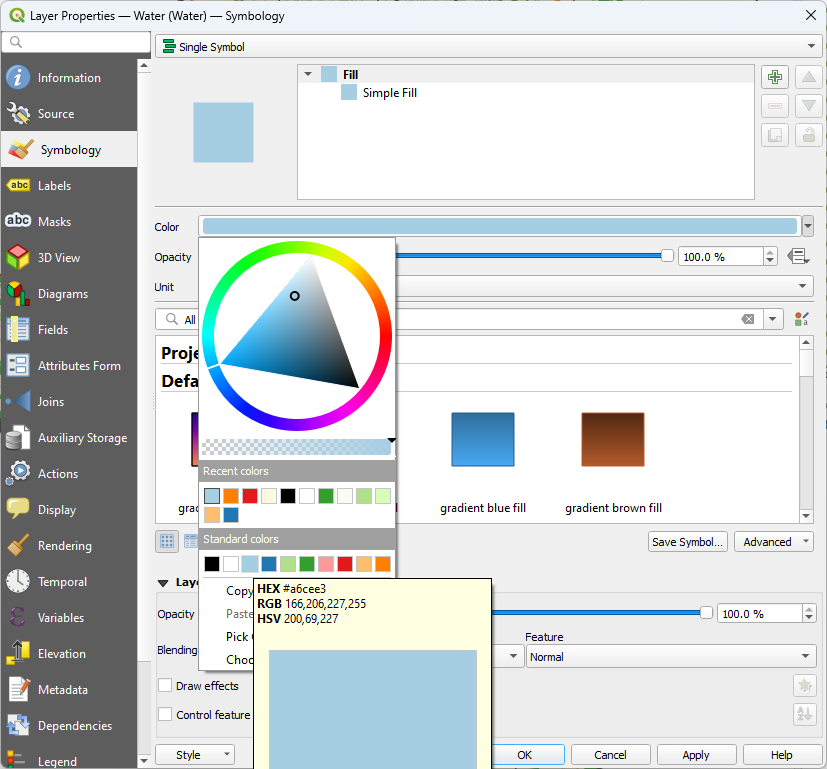
Next, in the Layer Properties, open the Symbology tab. Here, you can change the appearance of layers. Click the small drop down arrow beside the Colour box and choose one of the blues from the standard colours section to change the symbology of the water layer to blue.
Click Apply, then OK at the bottom right of the Layer Properties Dialog to apply and view the change to your map.
How can we help?
Contact us today to schedule a free consultation with a member of our team.