
Overlay Analysis in QGIS
This tutorial introduces overlay analysis in QGIS, a process that examines the spatial and geometric relationships between two or more geospatial features to create new or modified datasets for analytical purposes. A range of tools and algorithms available in QGIS for performing overlay analysis will be explored.
What You’ll Learn in this Tutorial
- Use processing tools in QGIS for spatial analysis
- Understand the principles of vector data processing
- Apply different overlay methods to analyze relationships between layers
- Determine the area of agricultural land within 500 metres of rivers in a watershed in Belize
- Calculate the total wooded area within planning districts in London, Ontario
Prerequisites
1. Extract the New River Lagoon Watershed
- Open QGIS 3.x or create a new project if it is already opened.
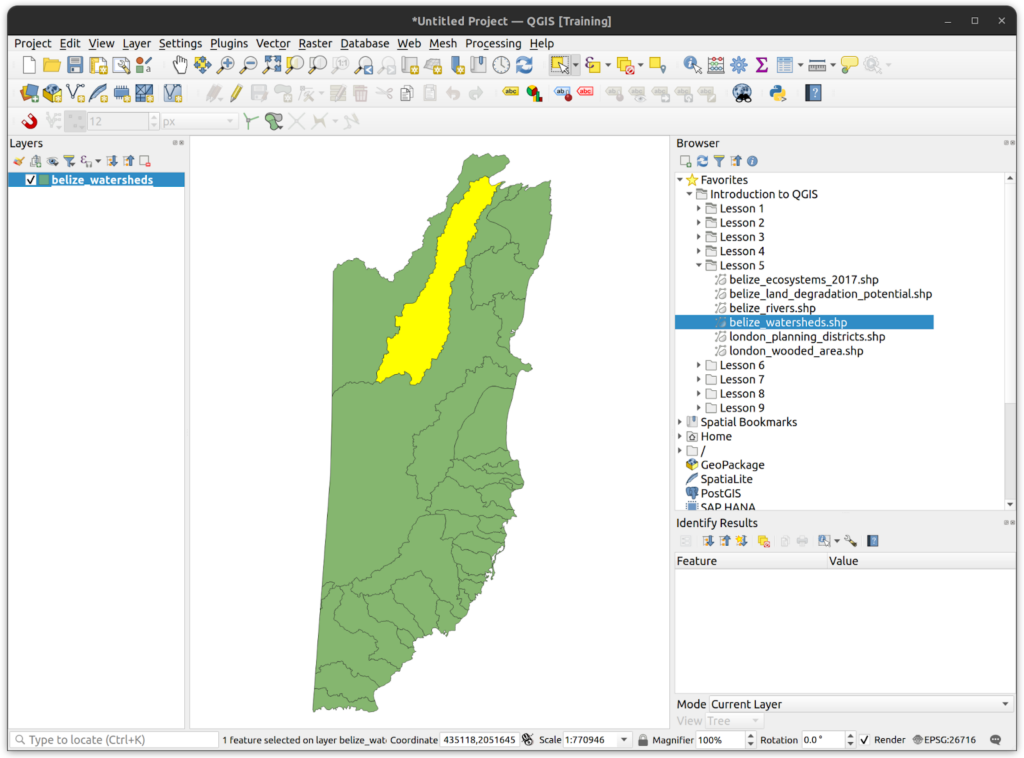
- On the Browser Panel, expand the tutorial folder and add the shapefile belize_watersheds.shp
- Extract the New River Lagoon watershed.
- Use the Identify tool to locate the New River watershed and then use the Select Features tool to select it.
- Once selected, export the layer to a new shapefile called new_river_watersheds.shp
- Right-click on the layer and select Export > Save Features as…
- Check the box labeled “Save only selected features”.
- Save the selection as a new shapefile in the tutorial folder.
- The layer should load automatically after saving it and it should only contain the New River Lagoon Watershed.

2. Clip the Land Degradation Layer
- Load the Belize land degradation layer and locate the clip tool in either top menu or in the processing tools.
- In the Clip tool, use the following input parameters:
- Input layer is the land degradation layer.
- For the overlay layer, use the New River watershed boundary layer you created in step 2.
- Save the result to the tutorial folder and call it new_river_land_degradation.shp
- Open the Statistics Panel to determine the mean degradation potential by producing statistics for the DEGPOT field (higher number, more degradation potential). How does the New River Watershed compare to the rest of Belize?
- Add the belize_rivers shapefile to the project and clip it to the boundaries of the New River watershed.
3. Intersection
- In this exercise, we want to determine the amount of agricultural land within 500m of rivers in the New River watershed. To do so, we will run an intersection between the buffered rivers and the agricultural areas in the study area.
- Buffer the clipped rivers by 500m and save the shapefile as rivers_buffer500m.shp in the tutorial folder. When using the buffer tool, be sure to select “Dissolve Result” to create a single multi polygon.
- Load the ecosystems 2017 layer and open the attribute table. Use the Select by Expression tool to select all areas that are used for agriculture (“ECOSYSTEM” = ‘Agricultural uses’). Keep this selection and close the attribute table.
- Locate the Intersection tool in the top menu (Vector > Geoprocessing > Intersection) or in the Processing panel. For input, select the ecosystems 2017 layer but make sure you check the “Selected features only” box below it. For overlay, select the buffered rivers of the New River watershed. Save the result to the tutorial folder and call it agriculture_within_500m_of_rivers.shp
- Create a new field in the agriculture_with_500m_of_rivers layer to re-calculate the area of each feature in hectares (hint: 1 hectare = 10,000 sqm. Name the new field “ha”). Using this field, determine the total area within 500m of rivers that is used for agriculture. If you did it right, you should get 11823.6 ha.
- How does this compare to the total area of the buffered rivers? What percentage of the total buffered area is used for agriculture? The answer should be 21.5%.
4. Calculate the Total Wooded Area Per Planning District
In this exercise, we will calculate the total wooded area in each planning district in London, Ontario, to determine where urban tree planting should be prioritized.
- Open a new project and add the london_wooded_area and london_planning_districts shapefiles to the map.
- Use the Dissolve tool with the london_wooded_area layer as the input. Leave all other parameters as default and hit run.
- Intersect the dissolved layer with the planning districts layer. Examine the attribute table.
- Add an area field in hectares to the intersection layer.
- Create a join between the London planning district and the intersection layer using the GIS_ID field that is common to both (there are actually a number of fields you could use, but this one works fine).
- Change the symbology of the London planning districts layer to Graduated and use the new area field as the value.
- Add a text label using the GIS_Featur field.
- Where would you prioritize tree planting in the city?
- Save the QGIS project to the tutorial folder.
How can we help?
Contact us today to schedule a free consultation with a member of our team.